File:Education.png
Revision as of 17:06, 15 September 2019 by Vanessa.au.2018 (talk | contribs) (Vanessa.au.2018 uploaded a new version of File:Education.png)
Size of this preview: 800 × 565 pixels. Other resolutions: 320 × 226 pixels | 2,923 × 2,066 pixels.
Original file (2,923 × 2,066 pixels, file size: 1.73 MB, MIME type: image/png)
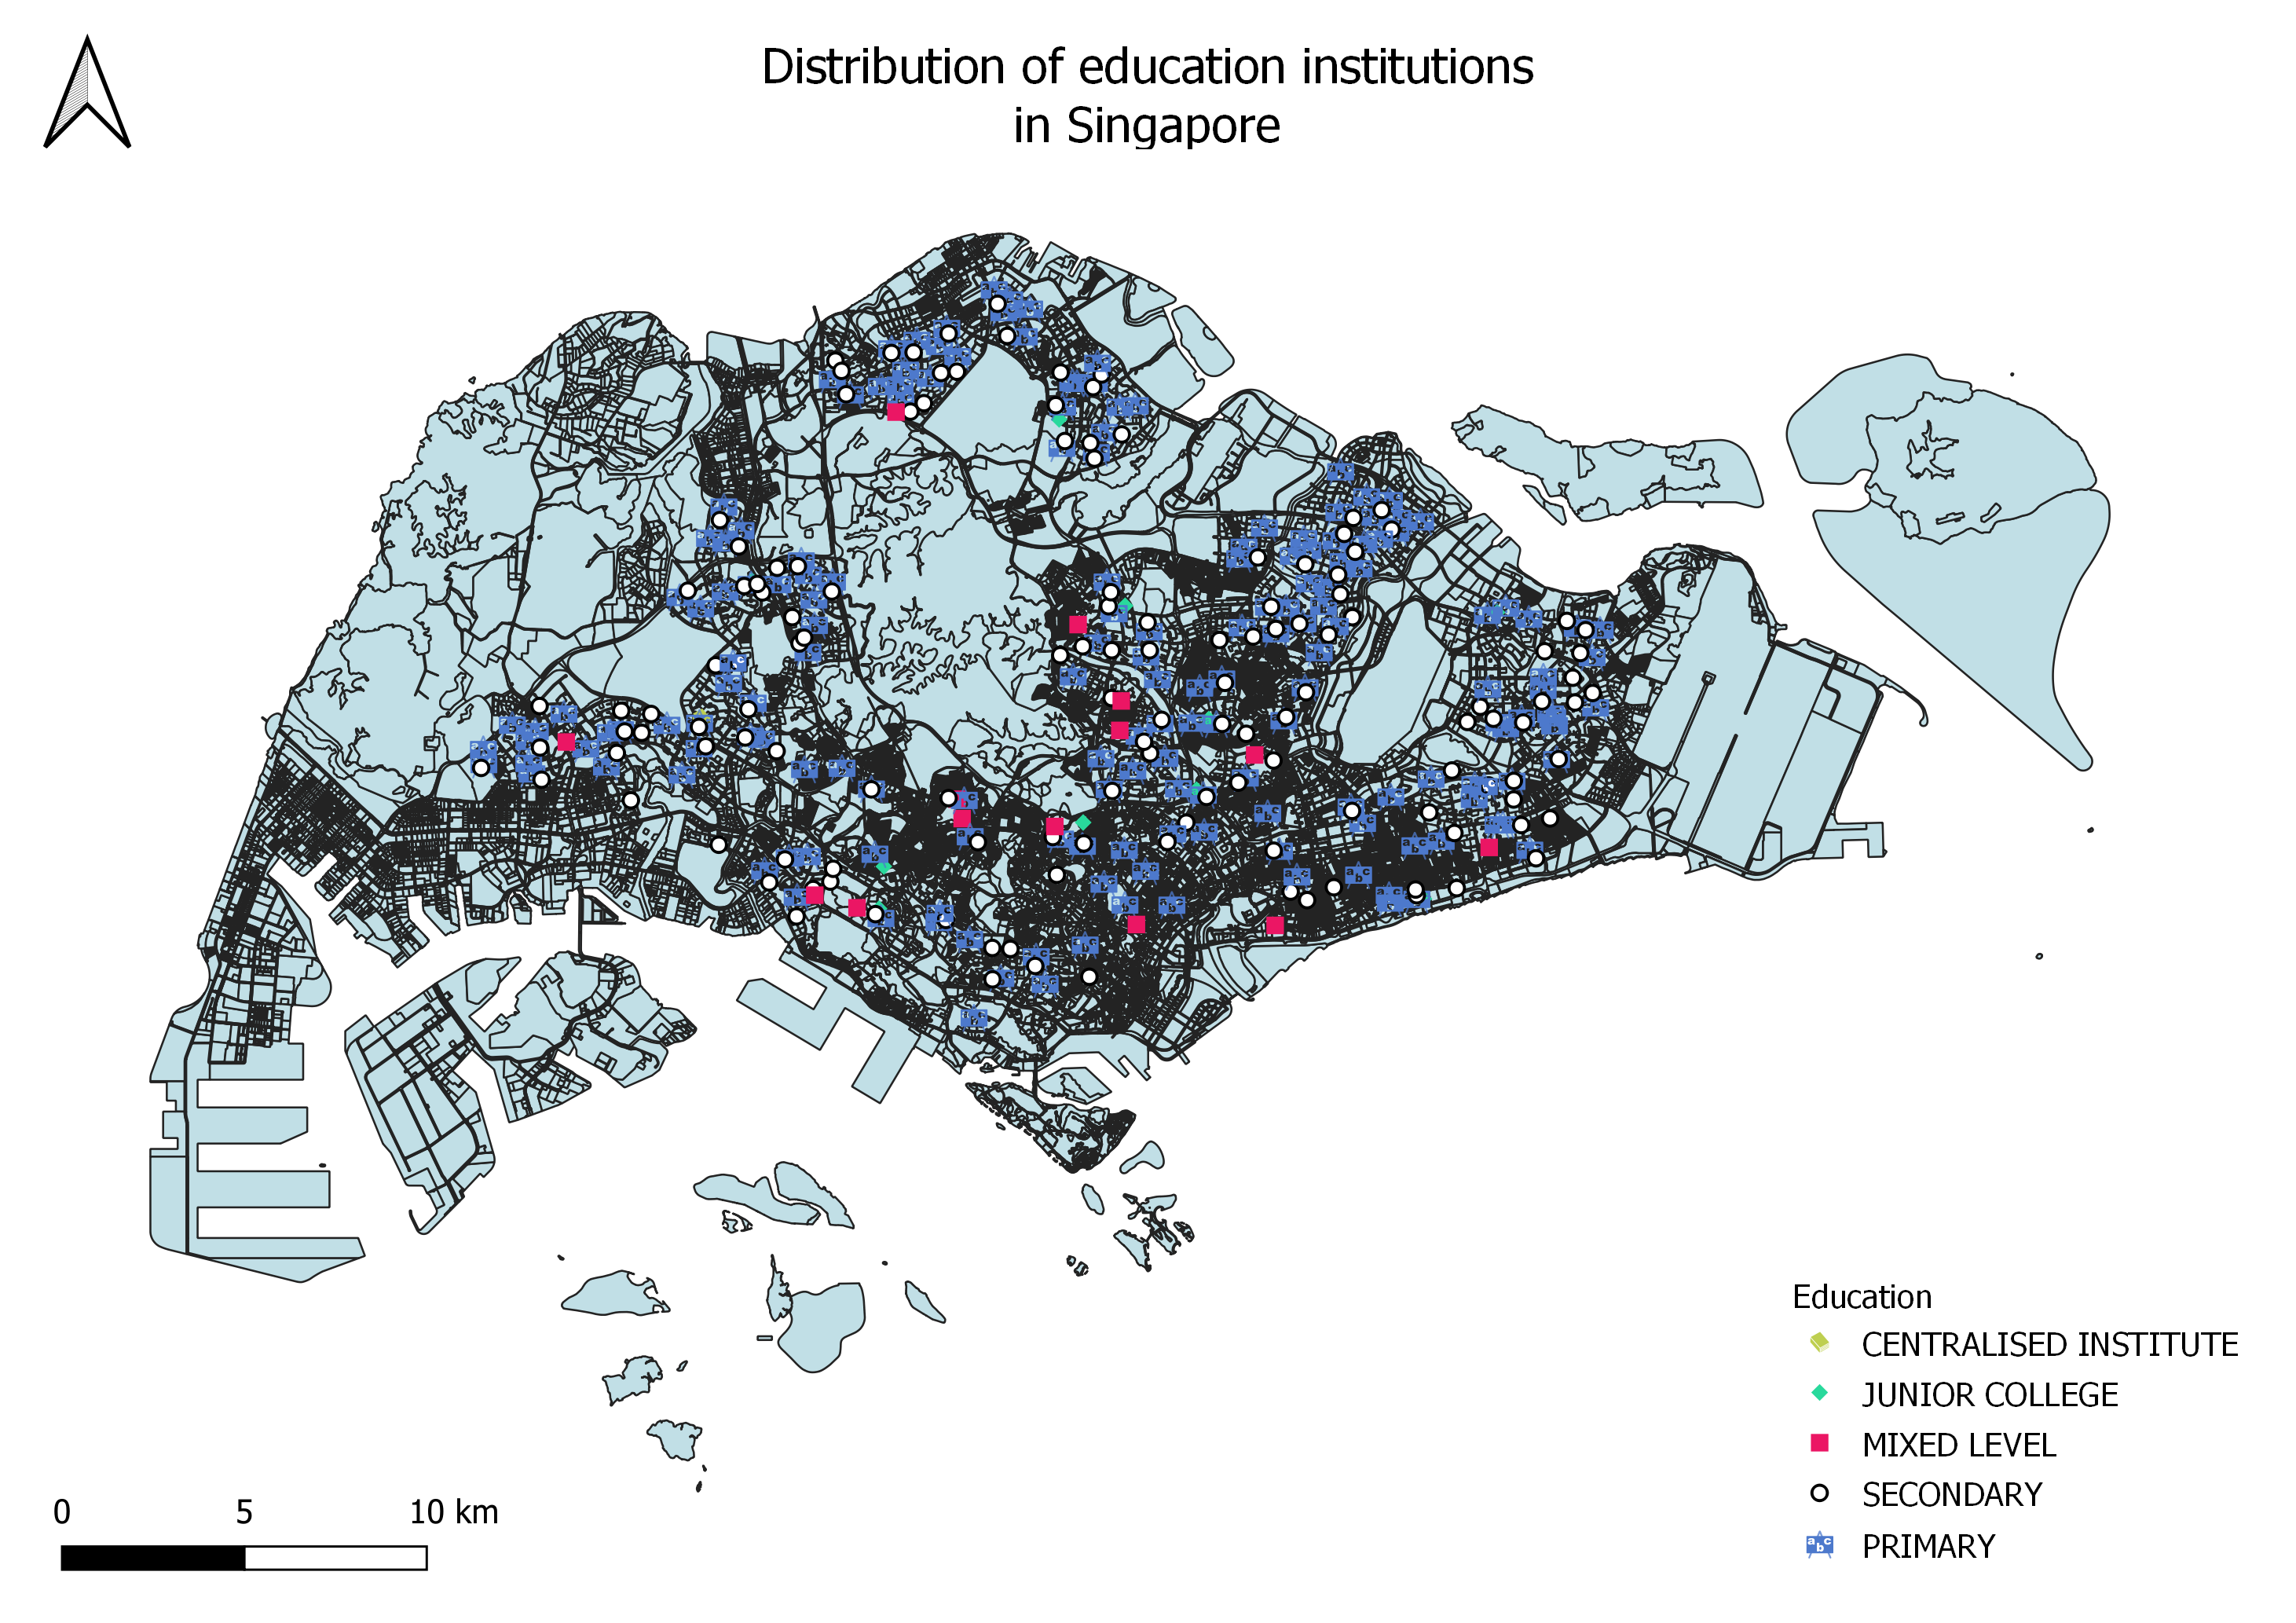
From the map, primary and secondary schools are much more in numbers as compared to JC and mixed levels. I chose 4 different symbols to represent each of the category. I had to increase the size of the symbols to make it more obvious from the map. Also, I chose to label the map according to its area so that users can easily identify which area the school is located at.
File history
Click on a date/time to view the file as it appeared at that time.
| Date/Time | Thumbnail | Dimensions | User | Comment | |
|---|---|---|---|---|---|
| current | 17:06, 15 September 2019 | | 2,923 × 2,066 (1.73 MB) | Vanessa.au.2018 (talk | contribs) | |
| 19:07, 14 September 2019 |  | 3,507 × 2,480 (1.68 MB) | Melanie.tan.2018 (talk | contribs) |
- You cannot overwrite this file.
File usage
The following file is a duplicate of this file (more details):
The following 2 pages link to this file: