SMT201 AY2019-20T1 EX1 Lee Shanzhen Leandra Faith
Revision as of 16:35, 15 September 2019 by Leandralee.2018 (talk | contribs)
Part 1: Thematic Mapping
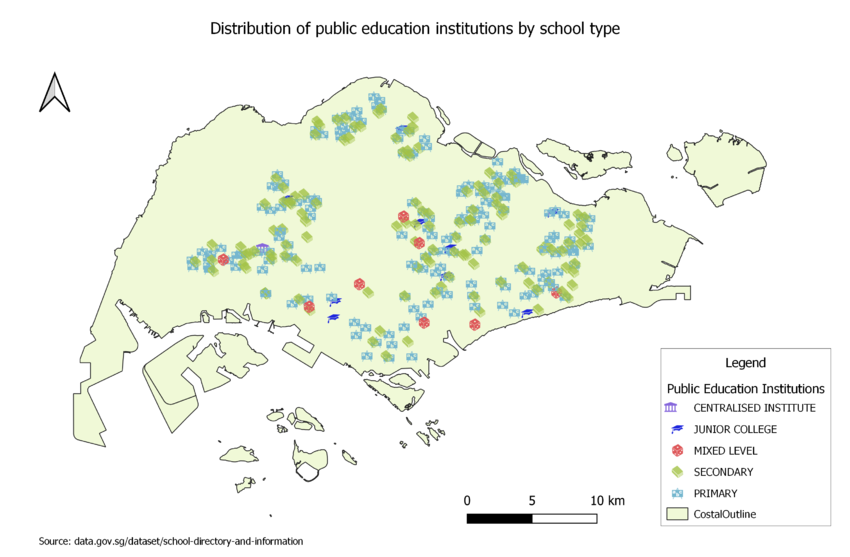
Using school information from data.gov.sg, prepare a thematic map showing the distribution of public education institution by school types such as primary, secondary, etc.
I have chosen to symbolise the different education categories using point symbols from the SVG vector symbol set, as it is easy to recognise the type of school from these symbols. This is an appropriate classification method for displaying the data given that the data on school type is qualitative and can be grouped into 5 discrete classes.
