From Geospatial Analytics for Urban Planning
Jump to navigation
Jump to search
Part 1
testing
Part 2
| Map Type |
Description
|
| 2010 Aged population Age65+ |
- Clusters majority found in Eastern part of Singapore
- Large numbers of Aged population in Pasir Ris, Bedok and Serangoon.
- Phenomena is clustered
|
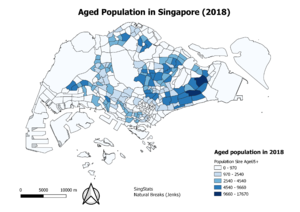
| 2018 Aged population Age65+ |
- The aged population seems to populate amongst the Eastern areas of Singapore, majority at the Tampines and Bedok area with the darkest colours, indicating high numbers of Aged population in those areas, also indicating more help must be provided to these areas to tackle issues related to aging population.
- Phenomena is clustered
|
| 2010 Aged Population Proportion |
- Proportion of Aged Population is greatest in Mandai, Sugei Kadut.
- Generally many subzones with large proportion of Age65+ , dispersed throughout Singapore
|
| 2018 Aged Population Proportion |
- More darker areas as compared to 2010 , signifying there are more subzones with higher proportion of elderly in 2018.
- Generally, distribution of high population of elderly is dispersed.
|
| % Change in Aged Population between 2010 and 2018 |
- Deeper colours mean greatest percentage change in Aged Population between 2010 and 2018.
- The phenomena of large numbers of increase in aged population is disperse and not clumped together, although there may be a slight trend in that there are more subzones with large increase in aged population in the Western areas of Singapore
|

