SMT201 AY2019-20T1 EX1 Heng Bing Chow
Part 1: Thematic Mapping
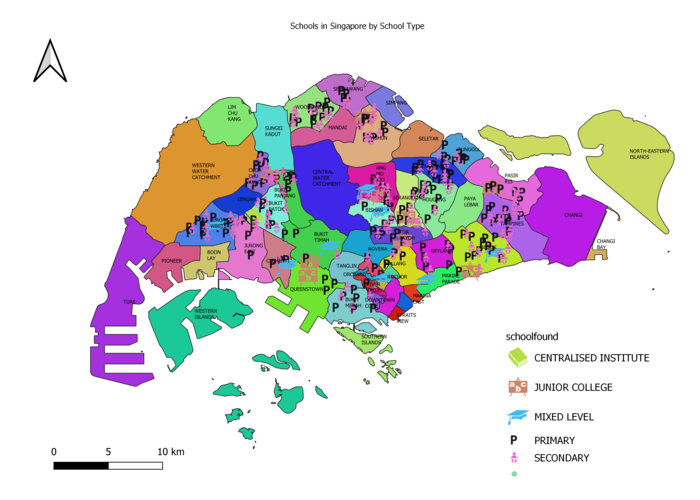
Distribution of public education institution by school types
First, I loaded the Coastal Outline and MP14 PLNG AREA NO SEA PL into QGIS, to serve as the base layer.
Next, I used MMQGIS > Geocode CSV with Web Service > General information of schools > Set Address as Address
Finally, Symbology > Categorized by mainlevel_ , Classify > then select SVG Marker Symbols.
I chose P for Primary, a Baby Symbol for Secondary, a Graduation Hat for Mixed Level, a ABC board for Junior College and a Stack of Books for
Centralised Institute.
Source: https://www.data.gov.sg/dataset/school-directory-and-information
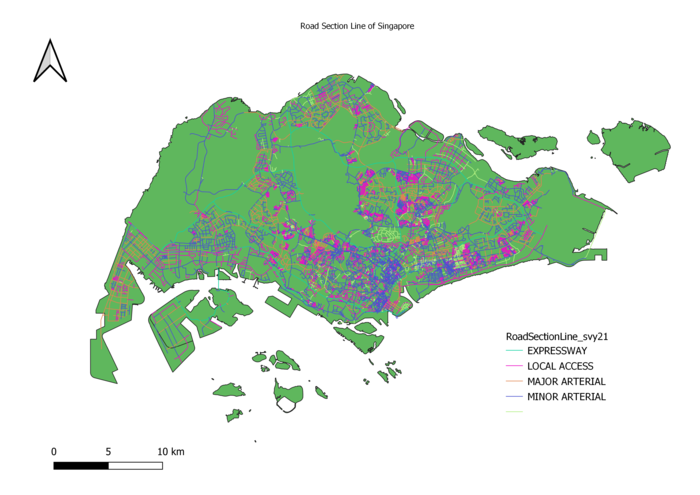
Road Network System of Singapore
After Downloading the RoadSectionLine data from LTA DataMall,
Open Attribute Table > Toggle Editing > Create New Field, RD_TYPE
Next, Filter and Select all rows with Expressway, Update Road_Type field as 'EXPRESSWAY'
Do the same steps for all other road types e.g. Road, Drive, Way, Lane, Link etc
Once done, RoadSectionLine > Properties > Symbology > Categorized by RD_TYPE > Classify Lines in Green are for Expressway, Orange for Major Arterial, Blue for Minor Arterial, and Purple for Local Access.
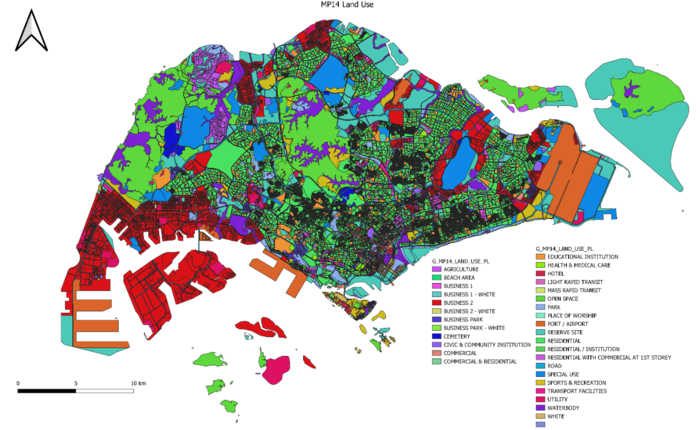
2014 Master Plan Landuse
First, load G_MP14 LAND_USE_PL into QGIS.
Next, Properties > Symbology > Categorized by LU_DESC > Classify > Apply > OK
The layer will display different colours according to the different type of use. E.g. Red for Business, Green for Open Space etc.
Part 2: Choropleth Mapping
- Aged population (+65) in 2010 and 2018.
- Proportional of aged population in 2010 and 2018.
- Percentage change of aged population between 2010 and 2018.


