SMT201 AY2018-19T1 EX2 Lim Zhong Zhen Timothy
|
|
|
Contents
Overview
Combined Layer for an overview
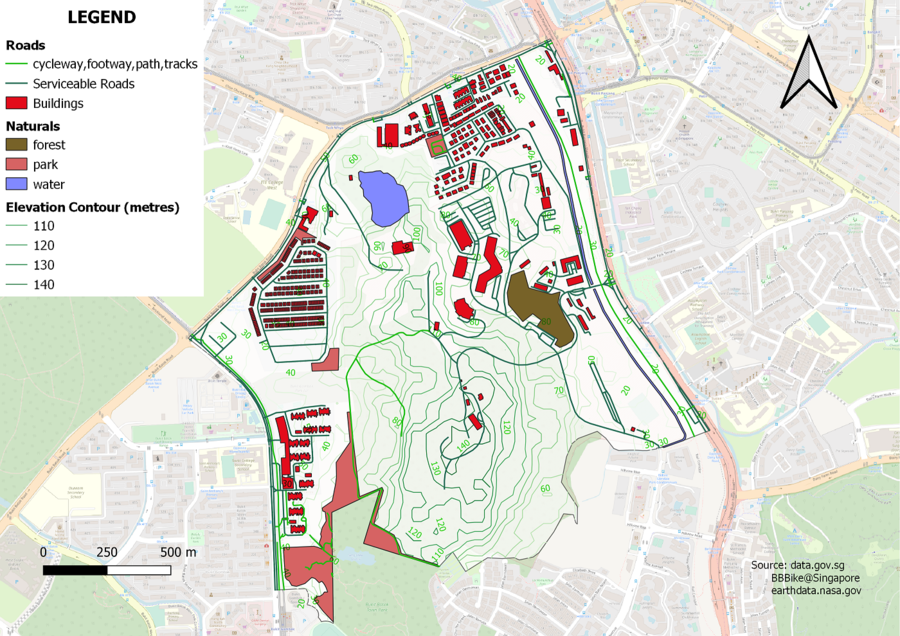
The above picture shows how the roads, buildings and natural land come together with a steepness contour to help the reader to understand Gombak.
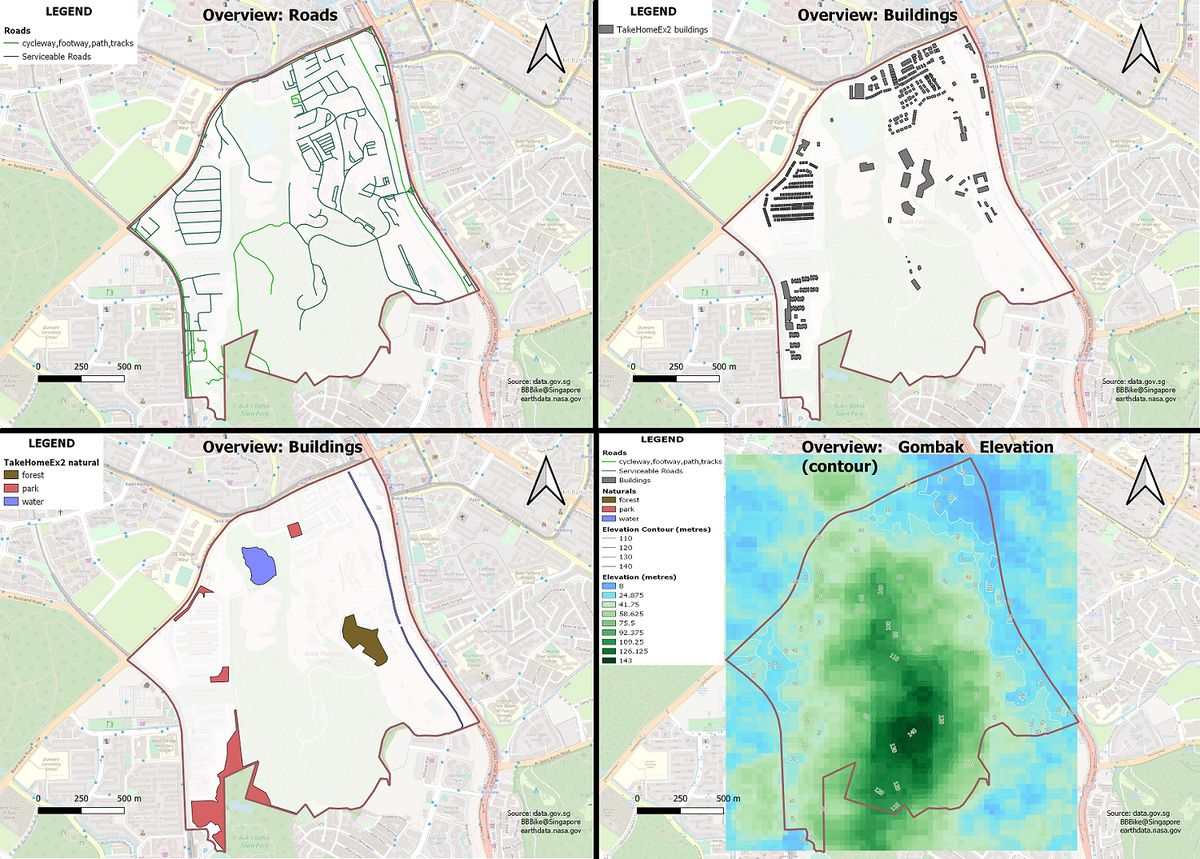
Individual layers of all Roads, Buildings, Naturals and Steepness in Gombak
Roads
The Factors affecting the accessibility to Communicable Disease Quarantine Centre (CDQC) will depend on how near CDQC will be to roads, tracks, etc as shown in the (Top Left) image above. As given, The selected site should be close to existing local roads, namely: service roads and tracks. This is to ensure easy transportation of building materials during the construction stage. Roads cycle, tracks etc: green, serviceable roads: blue
Buildings
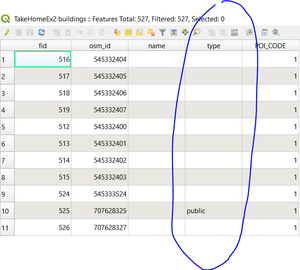
Due to the lack of specific ‘type’ data in bbBikes data for buildings.shp, I will not classify the buildings into various categories as it might paint an incorrect picture. I also tried to find other sources for ‘buildings shp’ but they all seem to be lacking in classifications too. The factors affecting Health Risk is as given (Top right): The selected site should be away from population i.e. housing areas and offices in order to avoid disease spreading to the nearby population.
Natural
The factors affecting Natural conservation is its proximity to forested land, park and water. CDQC should be as far away as possible to these land.
Naturals water: blue, forest: darkgreen, park: green
Slope
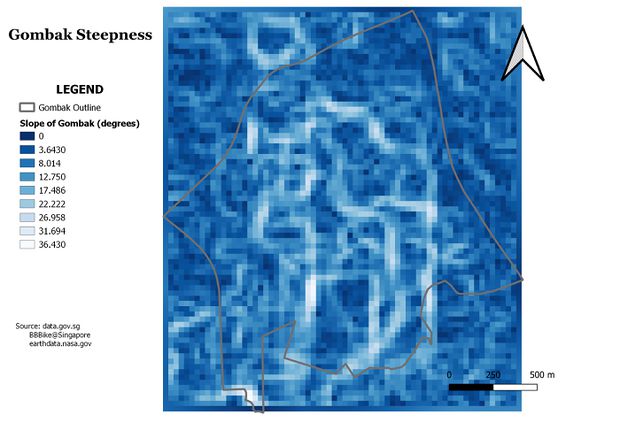
The factors affecting Economy will be steepness of the land (bottom-right image). The selected site should avoid steep slope. This is because construction at steep slope tends to involve a lot of cut-and-fill and will lend to relatively higher development cost.
Proximity Maps
The proximity views for roads, buildings and natural features were digitized showing the proximity range from 0 metres to 450 metres.
Data was split in 'continuous' although classes of 9 were defined for all.
These proximity layers serves to provide user a picture of where is a good or bad place to have CDQC. The darker the blue, the closer they are to the specific factor.
Move to Analysis to find out more on criterion and suitability!!
|
|
|


