From Geospatial Analytics for Urban Planning
Jump to navigation
Jump to search
Project Motivation
|
As part of our module, Geographic Information Systems for Urban Planning, we are collaborating with an international food chain to analyse 15 trade areas located in Taiwan's Kaohsiung and Ping Tung region. The international food chain currently uses manual methods of delineating their trade area which is largely time consuming. Therefore we aim to propose new and faster methods using QGIS to delineate the trade area.
We will also be analysing the points of interest (POI) within each trade area to determine the correlation between the POIs and sales revenue. To do so, we will be using simple and multiple linear regression analysis. The results of this project will provide the international food chain with the necessary geographic data analysis to make an informed decision regarding their sales and marketing strategy.
|
Project Objectives
|
There are two main objectives of this project:
1. To find the most suitable and efficient trade area delineation method
2. To analyse and generate insights into the current trade areas with respect to the selected points of interest and sales revenue
Project Deliverables:
1. Project artifact
2. Poster
3. Web Maps
4. Project Report
|
Data
Geospatial Data
| Name |
Description |
Geographic Representation |
Data Format |
Source |
Used in
|
| Taiwan Stores |
Contains store locations allocated to each group |
Point |
Geopackage |
Professor Kam, Client |
Allocation of Stores, Trade area delineation methods
|
| Administrative Boundaries
|
| County MOI |
Contains boundaries by county |
Polygon |
ESRI Shapefile |
Client |
Trade area Digitisation
|
| Town MOI |
Contains boundaries by town |
Polygon |
ESRI Shapefile |
Client |
Trade area Digitisation
|
| Village MOI |
Contains boundaries by village |
Polygon |
ESRI Shapefile |
Client |
Trade area Digitisation
|
| Points of Interest
|
| Business |
Businesses in South Taiwan |
Point |
ESRI Shapefile |
Client |
Sales Revenue Analysis
|
| CommSvc |
Community Service Facilities in South Taiwan |
Point |
ESRI Shapefile |
Client |
Sales Revenue Analysis
|
| EduInsts |
Educational Institutions in South Taiwan |
Point |
ESRI Shapefile |
Client |
Sales Revenue Analysis
|
| Entertn |
Entertainment places in South Taiwan |
Point |
ESRI Shapefile |
Client |
Sales Revenue Analysis
|
| FinInsts |
Financial Institutions in South Taiwan |
Point |
ESRI Shapefile |
Client |
Sales Revenue Analysis
|
| Hospital |
Hospitals in South Taiwan |
Point |
ESRI Shapefile |
Client |
Sales Revenue Analysis
|
| MiscCategories |
Miscellaneous facilities in South Taiwan |
Point |
ESRI Shapefile |
Client |
Sales Revenue Analysis
|
| ParkRec |
Parks and Recreational areas in South Taiwan |
Point |
ESRI Shapefile |
Client |
Sales Revenue Analysis
|
| Restrnts |
Restaurants in South Taiwan |
Point |
ESRI Shapefile |
Client |
Sales Revenue Analysis
|
| Shopping |
Shopping centres in South Taiwan |
Point |
ESRI Shapefile |
Client |
Sales Revenue Analysis
|
| TransHub |
Transporation hubs in South Taiwan |
Point |
ESRI Shapefile |
Client |
Sales Revenue Analysis
|
| TravDest |
Travel Destinations in South Taiwan |
Point |
ESRI Shapefile |
Client |
Sales Revenue Analysis
|
|
Location Maps
The location maps were used as a reference when digitising the operational trade area.
| Name |
Description |
Data Format |
Source |
Used in
|
| CK-20190624寬109cm長130 |
Location Map for trade area CK |
Powerpoint |
Client |
Trade area Digitisation
|
| JK-20190314寬83高72(木)含框 |
Location Map for trade area JK |
Powerpoint |
Client |
Trade area Digitisation
|
| KS20190823(外送範圍) |
Location Map for Kang Sang - 2 |
Powerpoint |
Client |
Trade area Digitisation
|
| LJ-20171030寬89高120(木)含框 |
Location Map for Lujhu |
Powerpoint |
Client |
Trade area Digitisation
|
| NZ地圖.jpg |
Location Map for NZ |
Powerpoint |
Client |
Trade area Digitisation
|
| NJ-20150902寬100高90(木) |
Location Map for NJ |
Powerpoint |
Client |
Trade area Digitisation
|
| PM-20171124寬84高76(鋁) |
Location Map for PM |
Powerpoint |
Client |
Trade area Digitisation
|
| QD-20180913寬80高100(木) |
Location Map for QD |
Powerpoint |
Client |
Trade area Digitisation
|
| RM-20190107寬110高110(木)含框 |
Location Map for RM |
Powerpoint |
Client |
Trade area Digitisation
|
| RZ-20190314寬90高119.7(木)含框 |
Location Map for RZ |
Powerpoint |
Client |
Trade area Digitisation
|
| TS-20190624-鋁-寬65高80 |
Location Map for TS |
Powerpoint |
Client |
Trade area Digitisation
|
| UC-20171226寬70高90(鋁) |
Location Map for UC |
Powerpoint |
Client |
Trade area Digitisation
|
| ZH-20190527寬90高88.8(鋁)含框 |
Location Map for ZH |
Powerpoint |
Client |
Trade area Digitisation
|
| ZY |
Location Map for ZY |
Powerpoint |
Client |
Trade area Digitisation
|
Scope of Work
|
1. Digitising the existing Trade Area
2. Extracting Points of Interest
3. Trade Area Delineation method (Buffer)
4. Trade Area Delineation method (Drive Time)
5. Sales revenue analysis
|
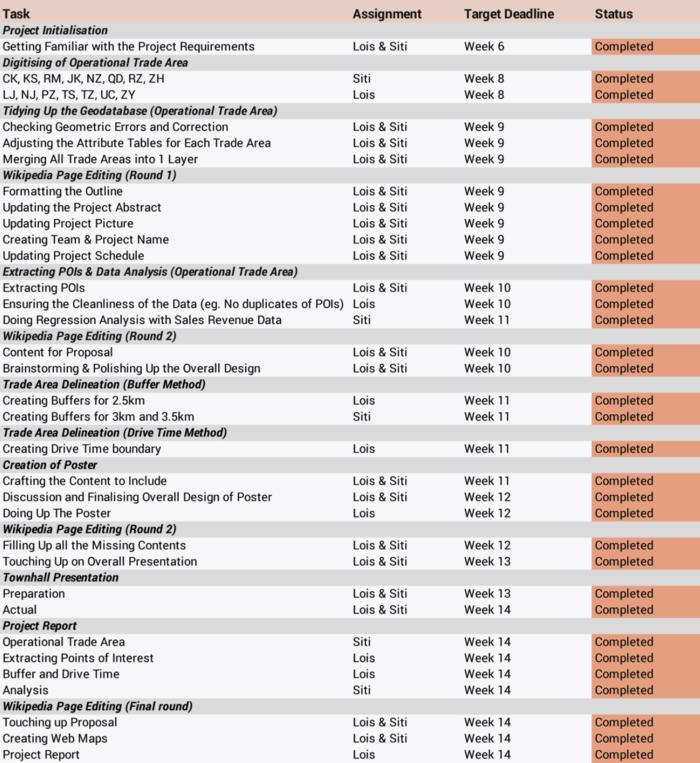
Project Schedule

