G2-Group04 Proposal
Project Motivation
As the FNB business expands, it gets increasingly difficult to accurately keep track of the various factors that affects the business performance. Various factors such as the number of POIs and population density can affect the human traffic in each of the trade area and should be considered with utmost importance. Hence, using QGIS and SAS Enterprise Guide will be able to provide a much more precise analysis for the outlets in the trade areas.
Also, the current method that has been adopted by the FNB business to delineate the trade areas is Microsoft PowerPoint. This is a less effective approach as compared to using QGIS. Hence, we believe that by utilizing QGIS to digitize and delineate the different trade areas, the analysis process will be less tedious and less time-consuming as the data is being integrated into a single platform and allows for an easier integration for future usage.
This provides the FNB business with a more realistic & better representation of their stores’ environment through the analysis of the data provided by the food chain business and generated by QGIS and SAS Enterprise Guide. This will allow the business to make plans on how to optimise performance for its stores.
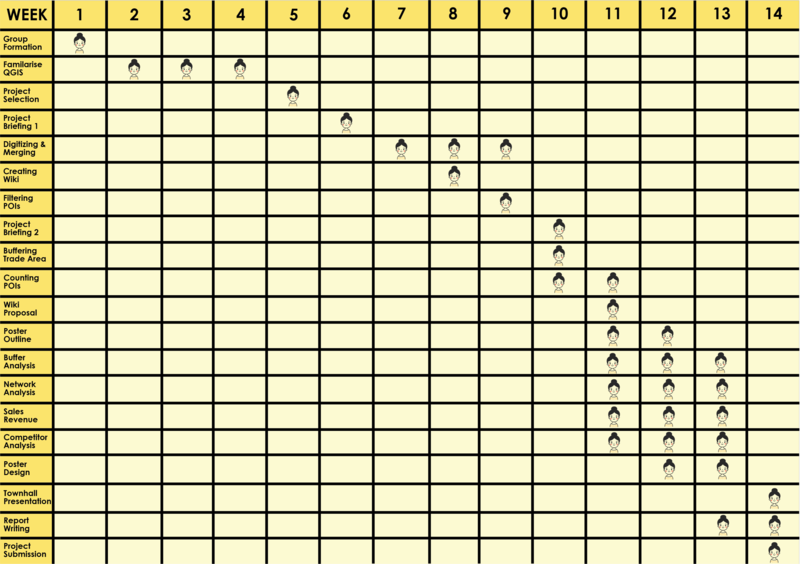
Project Timeline

