SMT201 AY2018-19T1 EX2 Soh Ze Yu
Contents
Map layout
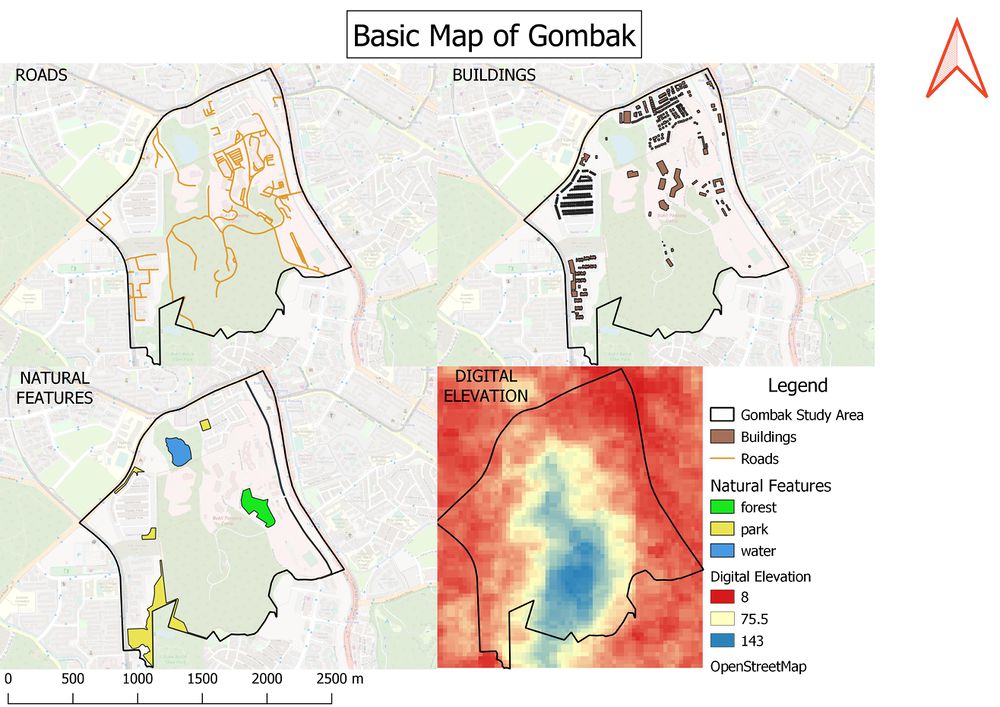
4 view layout of study area with:
For study area’s accessibility factor, the road was clipped with the study area of Gombak as the underlying area. The roads layer was then filtered out as we’re only interested in the service roads and tracks. The presence of other smaller roads serve no purpose and they will affect the model when analysing for a good location for the site.
Regarding economic factor, the slope was analysed using the ASTER Global Digital Elevation Model(GDEM) prepared by NASA and METI, Japan. The study area was used to clip the GDEM layer and we have a raster layer of DEM. The map is sorted out with single band pseudo colour and with equal intervals to make it easy to identify in 3 classes: high medium and low.
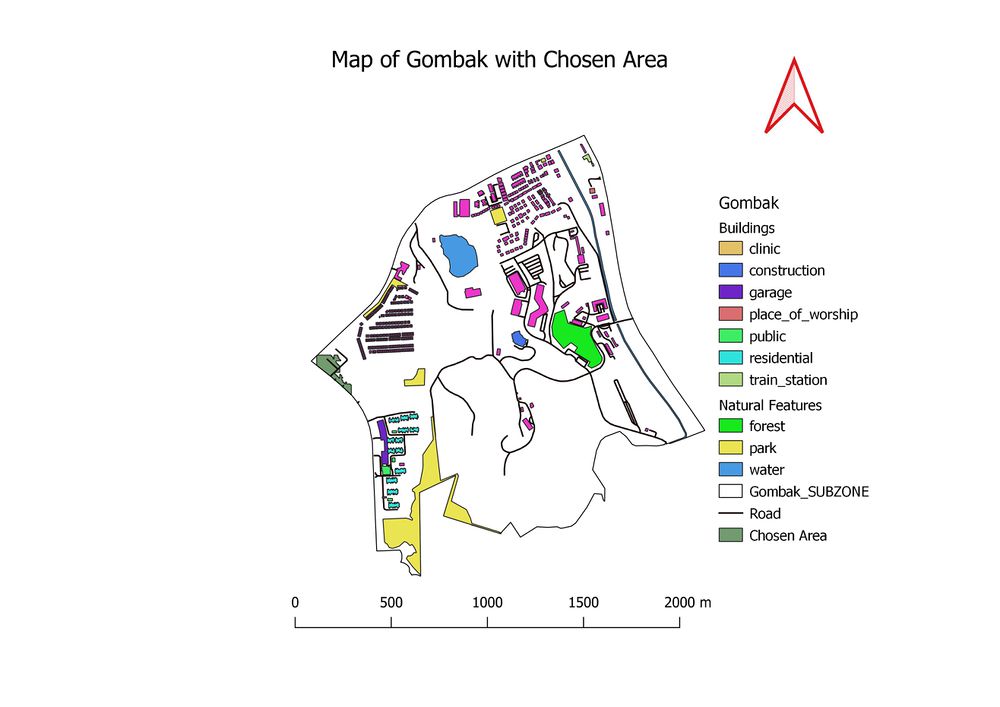
The health risk factor has to be taken into account due to the chances of disease spreading. The buildings were extracted from OpenStreetMap data sets and clipped to the study area for analysis further on.
Lastly the conservation of natural features had to be taken into account as well, and it was also sourced from the OSM data set. To have further clarification on the type of natural features, they were labelled to an intuitive colour. Blue for water body and green for forest, while the park took a yellow colour to distinguish it from features in the map.
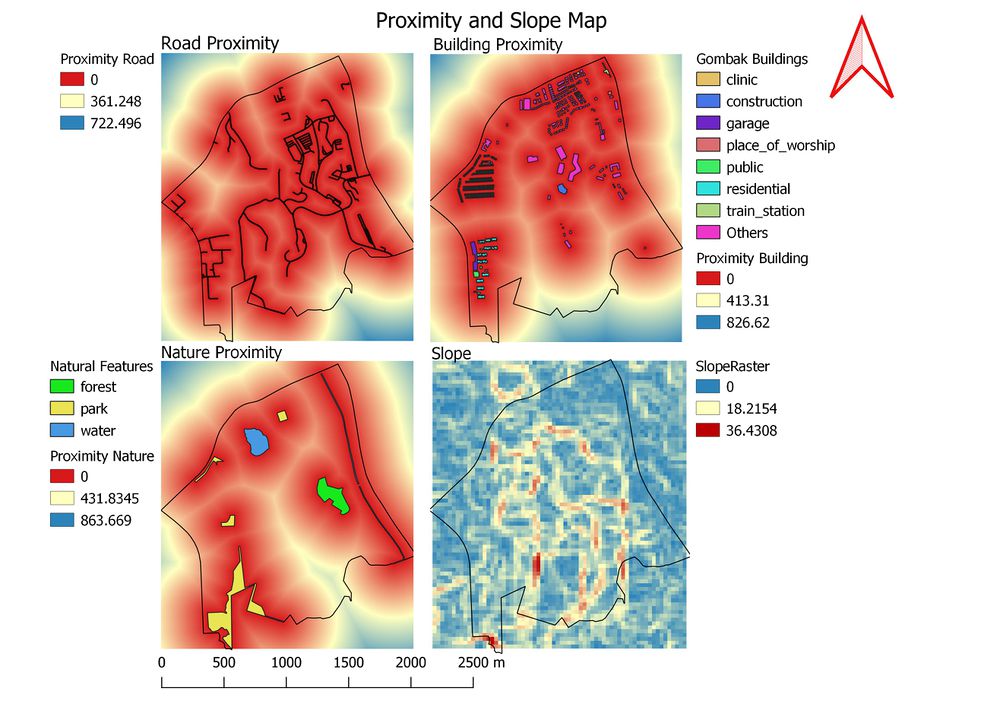
A map layout with four views of proximity and slope:
The main bulk of the analysis is regarding the proximity of the features. For road, the vector layer was rasterised and used to generate the proximity map as seen. For simplicity sake, they were sorted using single band pseudo colour for ease of identification. We see that Gombak is generally quite accessible except for the North-West and South-East area of white patches.
For buildings, a similar method was used to generate the raster file, and we can see that the general density of buildings is quite tight with the exception of the West and South areas.
For nature features, a similar method was used to generate the raster file, and we can see that it takes up a significant portion of Gombak with its proximity except for the south area.
Finally, for the slope, slope generated earlier was used and labelled with red to help identify the steeper areas which must be taken note of. We can see that the center of Gombak has quite some steep slopes right from the North to the South.
4 views of factor layer scores
To compare all factors in the same model, a standardising of the values was needed. We used a min and max method as it was able to capture the full range of values from each category and put it to analysis well. For road, the formula of 1-Proximity-Min/Max-Min was used. The reason for using 1 to calculate is to invert the score as a closer proximity is valued in this case rather than undesired. It is then sorted using single band pseudo colour for ease of understanding.
For health factor, a similar min max function was used to standardise and given the same sorted labelling style.
For nature conservation factor, a similar min max function was used to standardise and given the same sorted labelling style.
For economical factor, the same 1-Proximity-min/max-min formula was used. This is because there is less ease of construction given the slopes and an inverted proximity to slopes is preferred.
| Road | Slope | Nature | Building | |
|---|---|---|---|---|
| Road | 1 | 1/5 | 1/2 | 1/6 |
| Slope | 5 | 1 | 1 | 1 |
| Nature | 2 | 1 | 1 | 1 |
| Building | 6 | 1 | 1 | 1 |
| 0.082 | 8.2% |
|---|---|
| 0.318 | 31.8% |
| 0.264 | 26.4% |
| 0.336 | 33.6% |
| Consistency OK | 6% |
|---|
The AHP model was created to help calculate relative importance when calculating the best area for the site later on. For this, the building was given the highest score at 6 in relative importance as the presence of buildings possibly endangers residences and affects the most number of people with the longest lasting impact. Slope and Roads are Economical and Accessibility factors that are short term in regards to the construction, hence being ranked lowest. A slope will also affect road construction, hence being ranked more important than road. Finally nature lies between the importance of the above mentioned due to the disruption to both wildlife and lifestyle of residences if they were to be disrupted.
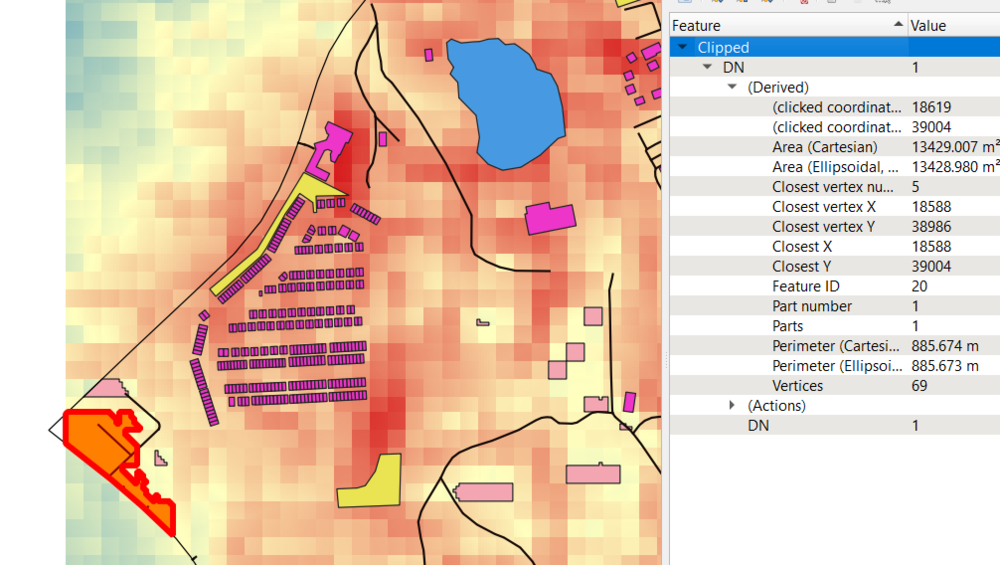
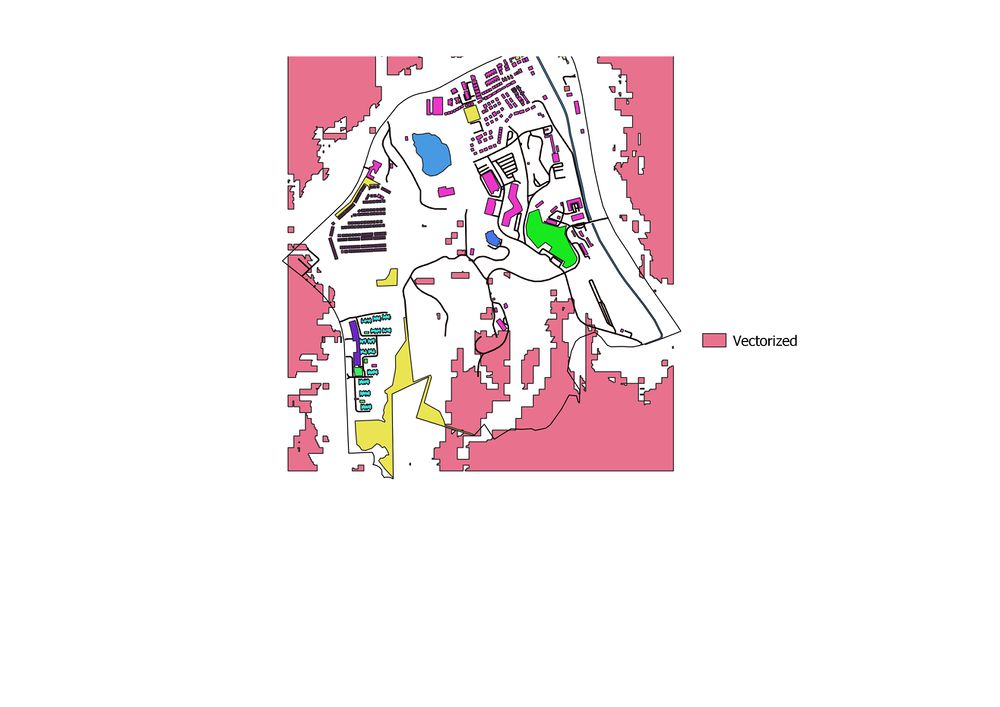
After using raster calculator to create the criterion map of suitable area, it was vectorised to get 2 types of area. 1 or 0. The 0 meant those unsuitable for the construction of the building and is represented by the white area after it was selected and deleted. The pink coloured polygons are the vectorised areas where calculation deemed suitable for the construction. However, the criteria was that it is above 10000 meter square and be inside of Gombak subzone. Hence a clip function was used to sort out the area of polygons suitable. We identified an area on the far west where the area has a good 13429.007m square and there are roads present as well, making it more suitable as compared to other land areas such as in the South.
