SMT201 AY2019-20T1 EX2 Lim Zhong Zhen Timothy
Added factor: Natural conservation Accessibility factor: during construction Read all specs detailly, there might be changes. Must use ahp method. Inclass exercise was binary Use criteria standardisation as they are different… After which apply weightage download AHP template
Need to do something to get the contiguous part out PREPARE WIKI
Look at Inclassex11 objective for model ans Should not use colour that the road is almost fused with the polygon. Your north arrow should not be bigger than your legend. See previous review exercise
Make it consistent, one north arrow and one scale bar Note: why all of study area except the last one
Road, buildings, natural ,waterway https://data.gov.sg/dataset/master-plan-2014-subzone-boundary-no-sea?resource_id=c30bfcc0-7e23-4959-b4d9-c5da5e00af54
Is it okay to clip at EPSG 4326 against a EPSG 3414? asterGDEM and roads 3414
	Is it ok for the edges to exit?
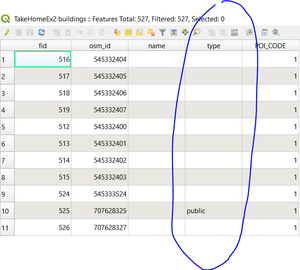
	Due to the lack of specific ‘type’ data in bbBikes data for buildings.shp, I will not classify the buildings into various categories as it might paint an incorrect picture.
I also tried to find other sources for ‘buildings shp’ but they all seem to be lacking in classifications too. Picture of map Buildings red Naturals water: blue, forest: darkgreen, park: green Roads cycle etc: asdasd, serviceable roads: asdad
For proximity I chose 450
Explain how the eco factors etc relates to the model generated
8-20 meters above sea level,
Takehome template
|
|
|
|
Title1
The cow flies over the fence
- bullet1
- bullet2
boldtext1
Priority Number Factor AHP Scoring 1 Health Risk 9 2 Accessibility 7 3 Natural Conservation 3 4 Economic 1 As the health risk of spreading the diseases is significantly more important than the other factors the weight of ‘health risk’ factor is much bigger than the others.
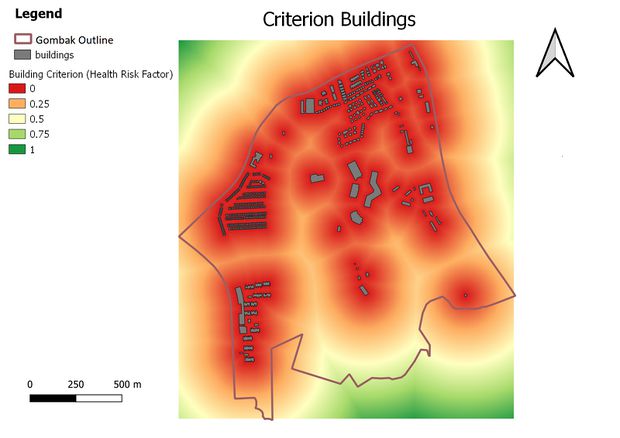
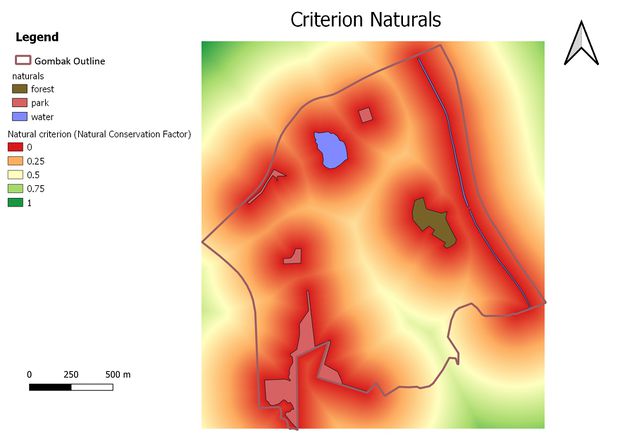
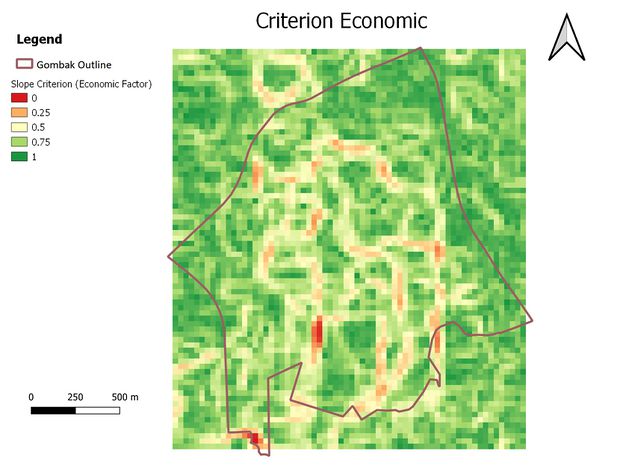
Criterion Red being bad yellow is okay, green is bad
Vectorized the raster
40,923m square of land to build
|
|
|
Overview
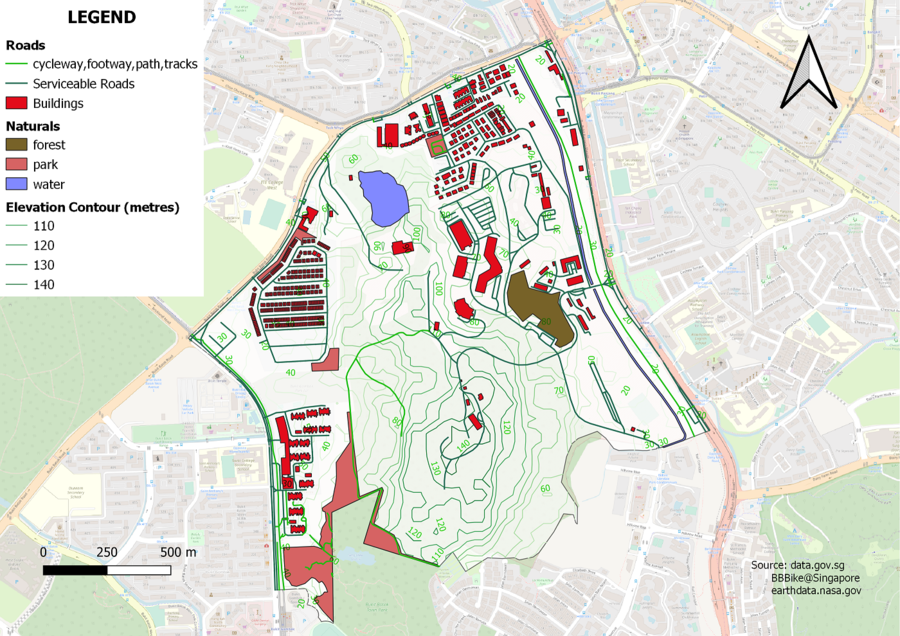
Combined Layer for an overview
The above picture shows how the roads, buildings and natural land come together with a steepness contour to help the reader to understand Gombak.
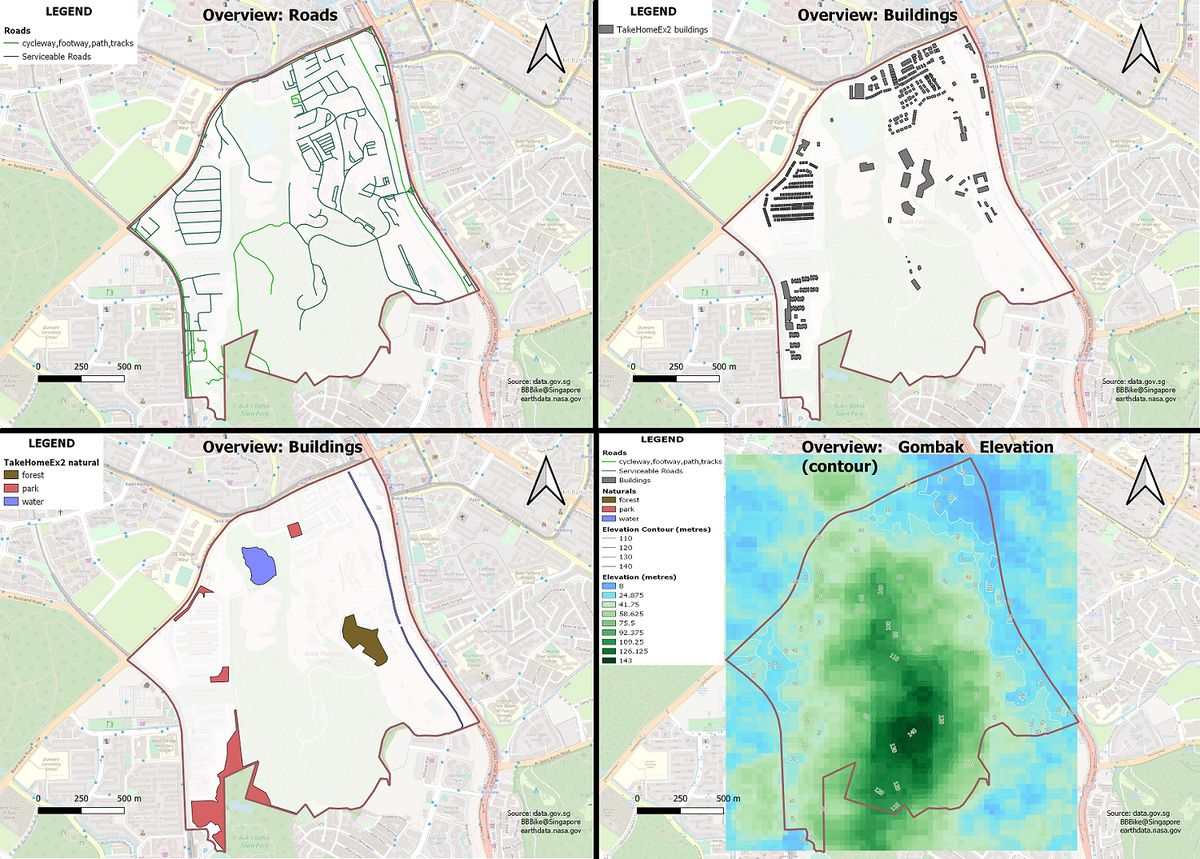
Individual layers of all Roads, Buildings, Naturals and Steepness in Gombak
Roads
The Factors affecting the accessibility to Communicable Disease Quarantine Centre (CDQC) will depend on how near CDQC will be to roads, tracks, etc as shown in the (Top Left) image above. As given, The selected site should be close to existing local roads, namely: service roads and tracks. This is to ensure easy transportation of building materials during the construction stage. Roads cycle, tracks etc: green, serviceable roads: blue
Buildings
Due to the lack of specific ‘type’ data in bbBikes data for buildings.shp, I will not classify the buildings into various categories as it might paint an incorrect picture. I also tried to find other sources for ‘buildings shp’ but they all seem to be lacking in classifications too. The factors affecting Health Risk is as given (Top right): The selected site should be away from population i.e. housing areas and offices in order to avoid disease spreading to the nearby population.
Natural
The factors affecting Natural conservation is its proximity to forested land, park and water. CDQC should be as far away as possible to these land.
Naturals water: blue, forest: darkgreen, park: green
Slope
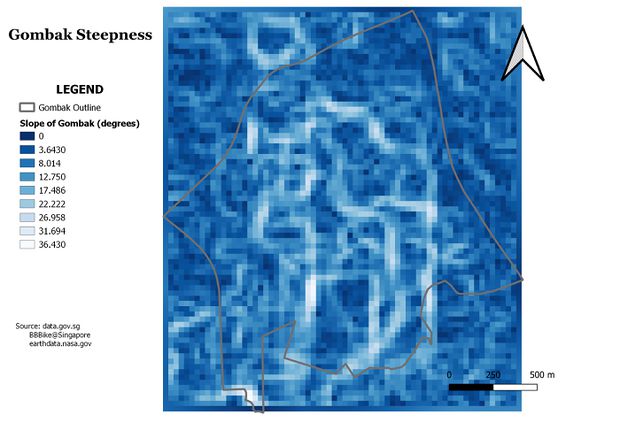
The factors affecting Economy will be steepness of the land (bottom-right image). The selected site should avoid steep slope. This is because construction at steep slope tends to involve a lot of cut-and-fill and will lend to relatively higher development cost.
Proximity Maps
The proximity views for roads, buildings and natural features were digitized showing the proximity range from 0 metres to 450 metres.
Data was split in 'continuous' although classes of 9 were defined for all.
These proximity layers serves to provide user a picture of where is a good or bad place to have CDQC. The darker the blue, the closer they are to the specific factor.
Move to Analysis to find out more on criterion and suitability!!
|
|
|
|
|
|
Criterion Maps
Data preparation
In order to do a ranked analysis, the layer data have to be normalised as the data now vary in scale. To that, Min-Max normalisation was used.
For example, To normalise road proximity, we take the (current_data - min_of given layer)/(max_of given layer - min_of given layer):" "Prox_road@1" - 0 / (717.023" - 0)
Another thing to note, is that the results for roads and steepness needs to be inversed. As the closer the roads or less steep the land the better!
Thus, I took (1 - normalised data) to get the correct comparison.
Next step
| Factor | Priority | Reason | AHP Scoring
|
| Health Risk | 1 | CDQC's top priority is to keep the diseased away from the general population, this is prevent the virus from spreading and causing an epidemic. Thus, this factor is highest
priority |
9 |
| Accessibility | 2 | Transportation is the key issue in swiftly getting the patient away from the masses. Thus, accessibility is also given a very high priority. | 7 |
| Natural Conservation | 3 | Although important, Parks and water beds and forests is not as populated as the buildings. | 3 |
| Economic | 4 | Singapore has limited land space, and do not have a lot of non-steep land. Thus, I believe it is worth investing on a place which poses less health risk, has good transportation and further away from natural conservation. | 1 |
Using the AHP template given by prof Kam, I performed a PairWise Comparison matrix to calculate weightage comparison of each factor.
The results show the weightage of each Factor, with 4.7% assigned to Economic, 36.6% to Accessibility, 47.9% to Health Risk and 10.9% to Natural Conservation
Suitability Map
Data prepartion
Using the data from the AHPmatrix, I created a ranked model for the suitability of the land for CDQC.
To do so, I had to take the each factor multiplied by its percentage weightage.
Using raster calculator to calculate the land suitability layer:
Expression:
("RoadCriterion@1"*36.6%) + ("BuildingCriterion@1"*47.9%) + ("NaturalsCriterion@1"*10.9%) + ("SlopeCriterion@1"*4.7%)
After combining all the various factors. A small part of Gombak is found suitable for the land. (Rainbow coloured)
On further analysis, this area is found to be around 40,000m2
This is more than the required 10,000m2.
Although marked suitable, a key thing to note is that this area is high in steepness. This can be seen from the change in elevation, ranging from below 60m to above 120m.
Reflection:
Thinking back, maybe i should not have given such a large deviation in weightage(importance) for the factors as there were only 4 factors. This might have skewed the data too much. Almost making Economic factor(steepness) barely noticeable.
|
|
|
