SMT201 AY2019-20T1 EX2 Tan Jie Ting Christine Suitability
|
Suitability |
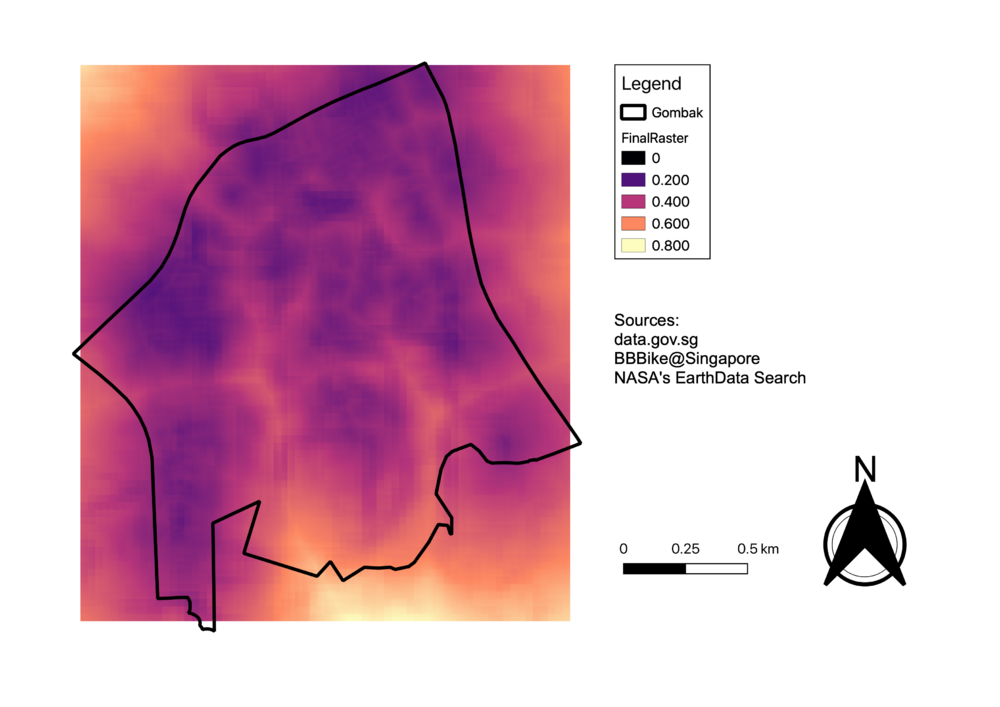
Raster Map
To obtain this raster map, I inputted the weights that were chosen in the previous step, AHP, into the raster calculator function in QGIS. The formula inputted is at follows:
"NormalisedRoads@1" * 0.200 + "NormalisedBuildings@1" * 0.635 + "NormalisedNatural@1" * 0.061 +
"NormalisedSlope@1" * 0.105
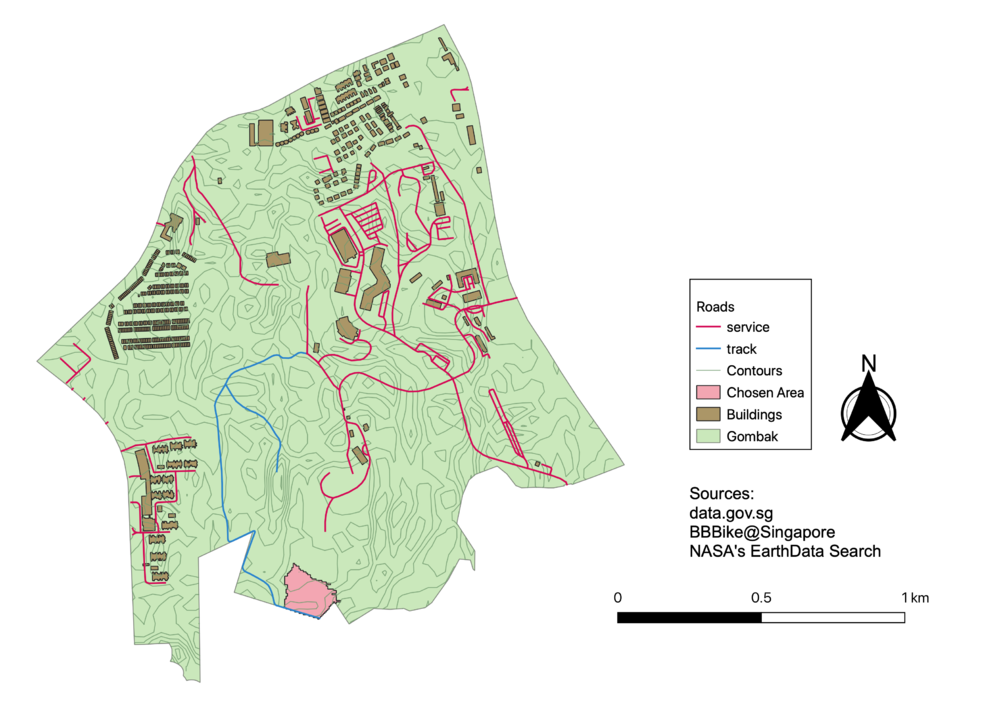
Reclassified Raster Map
From the above raster map, I decided to determine areas that I would use with a score of more than 0.60. With that, I performed "Reclassify by Table" to find the areas that have met that criteria. The output is as seen below:
Conclusion
After evaluating the two areas, only one of the areas had an area that was more than 10,000m2, and hence I chose this area to build the national Communicable Disease Quarantine Centre. This selected area has an area of 21667m2.
Evaluation
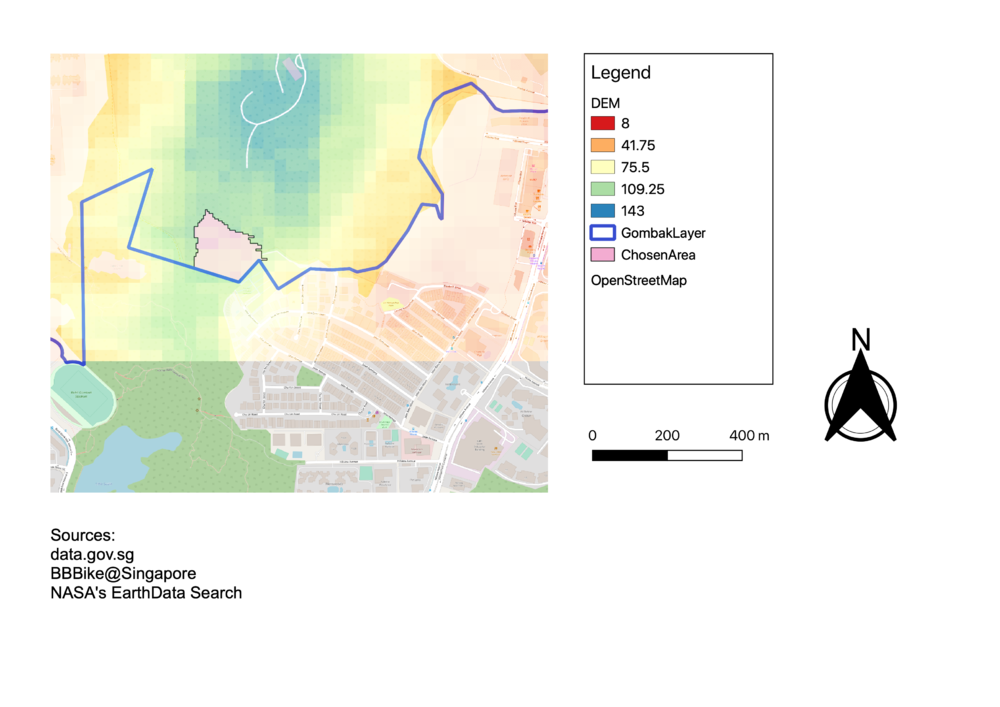
Upon looking at the end product together with the Open Street Map Layer, I realised there was a flaw in that the selected site was close to buildings from the area south of Gombak, which were not accounted for in the analysis. However, I would still approve of this area as amongst the other areas in Gombak, this was the most only area within Gombak that fit the criteria if we only analyse the features in Gombak. Additionally, this area is on a hill, whereas the other buildings are below the hill, making it further distance-wise.


