SMT201 AY2019-20T1 EX2 Lim Qiu Hui Candy
Contents
Overall Map Views
Roads in Gombak
The map titled Roads shows the service and track roads in Gombak, used in transporting building materials for our Centre. It is notable that there is a high concentration of roads in the northern part of Gombak. Without considering other factors, it is instinctive for us to infer that perhaps the selected site can be placed in the north, where there are more roads and is more accessible.
Buildings in Gombak
The map titled Buildings shows the buildings in Gombak. It is notable that there are barely any buildings in the southern part of Gombak. Without considering other factors, it is instinctive for us to infer that the selected site can be placed in the south, where there are less buildings and prevents diseases from spreading to the nearby population.
Natural Features in Gombak
The map titled Natural Features shows the natural features in Gombak, like parks, water bodies and forested land. It is notable that there are barely any natural features in the central to southern part of Gombak. Without considering other factors, it is instinctive for us to infer that the selected site can be placed anywhere from central to south Gombak, where there are fewer natural features and prevents the construction from affecting the nature.
Elevation of Gombak
The map titled Elevation shows the elevation of land in Gombak. It is notable that the highest elevation is of 145m in central Gombak, and based on further research, that location is where Bukit Gombak Hill is located at. Hence, we can infer that the selected site should be placed away from the vicinity of Bukit Gombak Hill for natural conservation purposes and any construction on the steep land nearby will incur high costs.
Insights
It is hard to conclude at a glance where our selected site should be, without considering the 4 maps together as a whole and with the help of further GIS analysis. Hence, we convert these vector datasets into raster data for us to proceed with our modelling for the land suitability analysis.
Overall Proximity Map Views
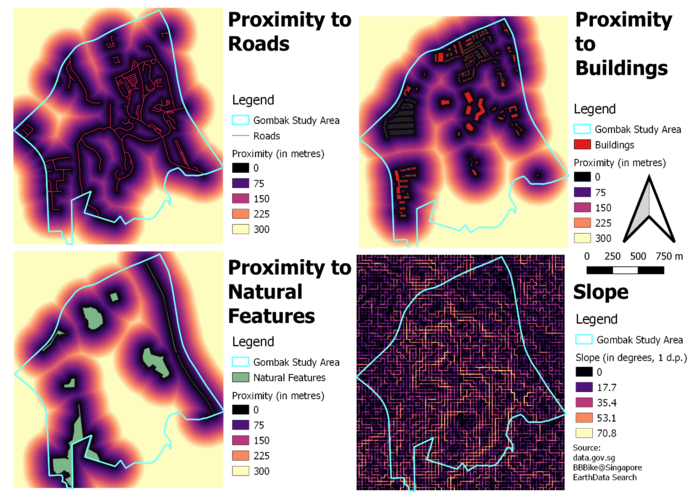
In general, all the scales for the proximity in metres are set at a minimum of 0 to a maximum of 300 metres for a standardized and fair comparison throughout the three maps. The colours across the maps are standardized and the map layers are zoomed to its native resolution (100%) as well, for an easier comparison across all maps. A POI_CODE of 1 was assigned to the attributes tables of layers that are used for analysis, which are the raster layers for Roads, Buildings and Natural Features after conversion from its vector layer form.
Proximity to Roads in Gombak
The Proximity to Roads map shows the raster distance of locations on the map, within Gombak, to the roads. As the distance from the roads increase, the colours displayed to represent proximity gets lighter as well. From the QGIS modelling, the legend of this layer indicates that the furthest distance from the roads is 772.50 metres (rounded off to 2 decimal places).
Proximity to Buildings in Gombak
The Proximity to Buildings map shows the raster distance of locations on the map, within Gombak, to the buildings. As the distance from the buildings increase, the colours displayed to represent proximity gets lighter as well. From the QGIS modelling, the legend of this layer indicates that the furthest distance from the buildings is 826.62 metres (rounded off to 2 decimal places).
Proximity to Natural Features in Gombak
The Proximity to Natural Features map shows the raster distance of locations on the map, within Gombak, to the natural features. As the distance from the natural features increase, the colours displayed to represent proximity gets lighter as well. From the QGIS modelling, the legend of this layer indicates that the furthest distance from the natural features is 863.67 metres (rounded off to 2 decimal places).
Slope of Gombak
The Slope map shows the angle of inclination to the horizontal land in degrees. As the slope degree increases and the slope gets steeper, the colour lightens. The legend of Slope layer shows that the minimum and maximum values of the slope values are 0 and 70.8 degrees respectively, as I adjusted the land area to by 5m x 5m instead.
Overall Criterion Score Map Views
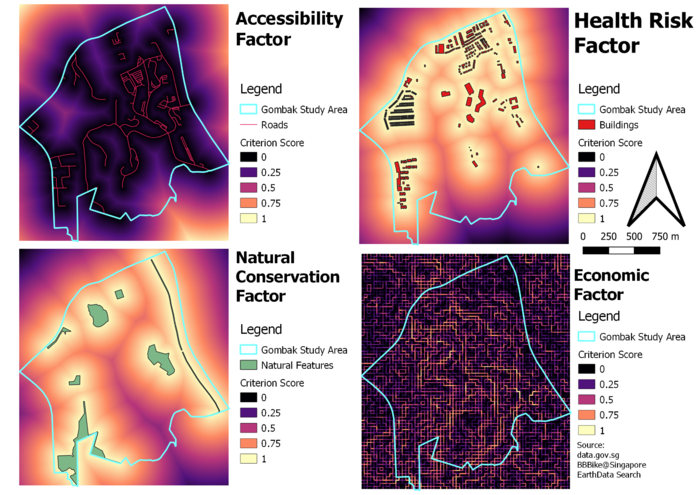
At this stage, we must evaluate each of the proximities relevant to the relevant 4 deciding factors for the construction of the Centre. To do so, we perform a Min-Max criteria standardisation technique to convert all the proximity maps to be based on a standardized criterion score of 0 to 1.
Before we do the Min-Max technique, we need to understand that there are 2 perceptions of what is considered “better” for the construction. For Accessibility and Economic factors, the lower the score, the more suitable the land for construction. Whereas for Health Risk and Natural Conservation factors, the higher the score, the more suitable the land for construction.
Hence before performing the Min-Max criteria standardization, we need to inverse the proximity values of the Proximity-Buildings and Proximity-Natural Features maps for the scores to make sense.
The inversion is done simply by this simplified equation on the raster calculator, which is 1 – [Map Layer].
Accessibility Factor
For the accessibility factor, it is derived from the proximity to roads map. As shown in the map, the minimum score of 0 means that the closer the proximity of the location to the roads, the lower the criterion score which is better. This makes sense as we want to build the centre as close to existing roads to ensure easy transportation of building materials during the construction stage.
Health Risk Factor
For the health risk factor, it is derived from the proximity to buildings map. As shown in the map, the minimum score of 0 means that the further the proximity of the location to the buildings, the lower the criterion score which is better. This makes sense as we want to build the centre as far away as possible from the population to avoid disease spreading to the nearby population.
Natural Conservation Factor
For the natural conservation factor, it is derived from the proximity to natural features map. As shown in the map, the minimum score of 0 means that the further the proximity of the location to the natural features, the lower the criterion score which is better. This makes sense as we want to build the centre as far away as possible from the natural features to prevent construction from affecting the nature. Also, construction away from natural features prevents further objection from the public. The destruction of natural features to give way to construction works causes public outcry – as seen from the exhumation of the Bukit Brown Cemetery to make way for the construction of new roads.
Economic Factor
For the economic factor, it is derived from the slope map. As shown in the map, the minimum score of 0 means that the lower the slope angle, the lower the criterion score which is better. This makes sense as we want to build the centre at low-lying areas to reduce the cut-and-fill and leads to relatively lower development cost.
AHP Input Matrix and Results
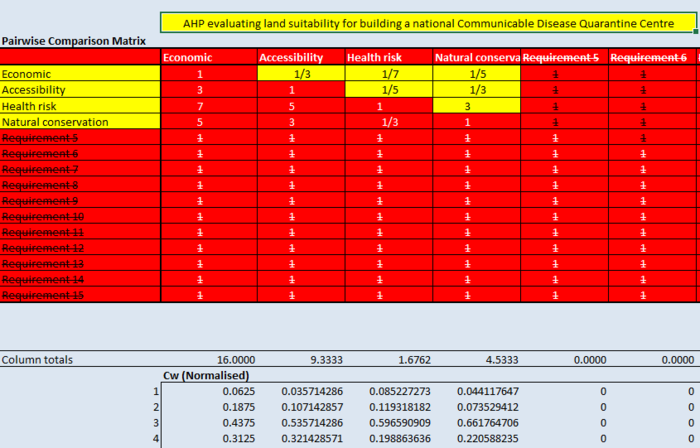
Above are the relevant screenshots for my AHP input matrix. In my opinion, the preference ranking of the criterion will be (in order of importance):
1. Health risk: As the centre is a Disease Quarantine Centre, it is most important that it is situated far away from population so that the risks of the main population being infected is kept at a minimum. This prevents a massive disease outbreak, which can cause severe consequences and panic to Singapore.
2. Natural Conservation: As mentioned earlier, it is important to take note of this factor to prevent further public unhappiness and outcry over construction near natural features. Besides, this is also to reduce the risks of the diseases from spreading through air to the nearby biodiversity, which can also end up spreading the diseases to the population.
3. Accessibility
4. Economic
As a result, after my inputs in the matrix, it is shown that the scores that I’ve included in the matrix are relevant, as the consistency check results were 7%. The highest AHP score of 0.558 (55.8%) was given to the Health Risk factor, next score of 0.263 was given to the Natural Conservation factor, 0.122 given to the Accessibility factor and the least important factor, Economic, was given a score of 0.057.


