SMT201 AY2019-20G1 EX2 Nigel Poon Wei Chun
Contents
Part 1
Study area (Gombak) with it's elevation and its infrastructure ( Target roads, Buildings , Natural Features )
Using the selected infrastructures, we hope to find a suitable area to build the next National Communicable Disease Quarantine Centre within Gombak. We will have various factors in mind while deciding the location such as Economic, Accessibility, Health Risk and Natural Conservation which will be talked further in detail later.
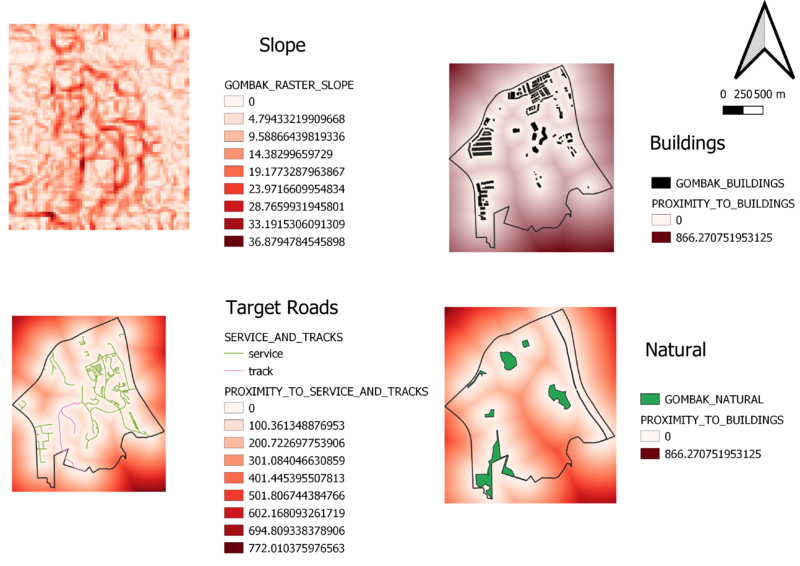
With the above layouts, we can have a rough understanding of locations of buildings, natural features as well as service and track roads which will be our target roads of this insight report. The bottom right map layout show the elevation of Gombak with the redder values being higher elevation
Part 2
Proximity to Natural Features, Buildings , Target Roads and Slope
The proximity to roads is represented by the gradient between black and white. The closer it is to black, the nearer it is to the roads. The closer it is to white, the further it is away from roads. The gradient provides a good and clear visualization of proximity to the roads. As the site for CDQC should be near existing service roads and tracks, this layout helps to determine where CDQC should be site at Gombak based on the proximity to roads.
The above layout seeks to represent proximity of the various features through the colours white to red . The whiter an area signals that the closer to selected variable feature of each map. For example , in the case for buildings proximity map the white area means that the area is relatively close to a building .

