SMT201 AY2019-20G1 EX2 Kok Jim Meng
Contents
Part 1: Map Layouts of Extractions
Target Roads
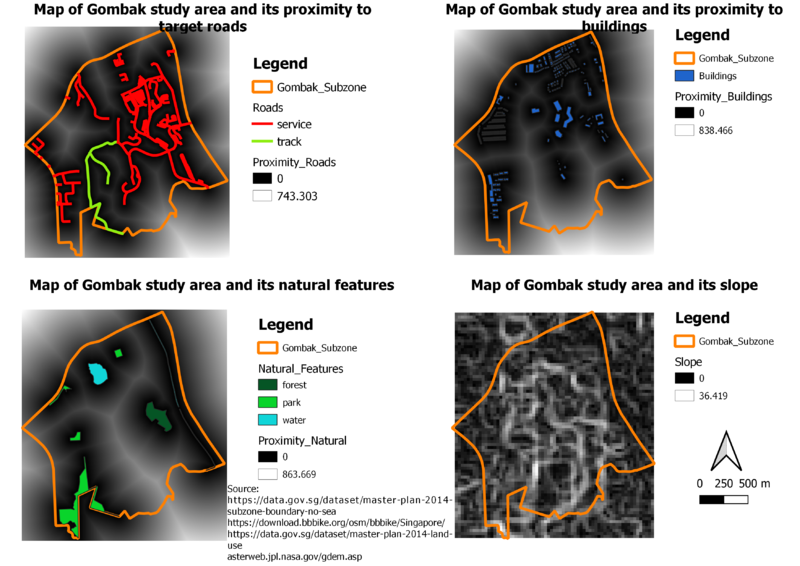
There is a higher number of target road networks in the central and eastern part of the Gombak study area. To build the quarantine centre, it is suitable to build at these areas due to the transportation of the materials for the construction of the quarantine centre.
Buildings
By using Master Plan 2014 Land Use and OSM’s buildings layer, I intersect them and classify them according to the building types. Residential buildings are saturated in the western side and northern side of the study area. Furthermore, military buildings (i.e. Bukit Panjang Camp) are at the central of the study area. In addition, train stations are at the eastern side of the study area. Hence, it is ideal to set up the quarantine centre at the southern side of the study area to stay away from those stated buildings.
Target Natural Features
According to the three types of nature features namely forest, parks, and water, the proposed quarantine centre needs to stay away from these nature features. Hence, it is ideal to set up the quarantine centre at the southern side of the study area.
Digital Elevation
The colours of the elevation are represented where green means flat land, orange-yellow means mid-level land, and red means high-level land. To fulfill the economic factor of building at gentle slope, it is suitable to build the quarantine centre at the green areas of the slope according to the raster.
Part 2: Map Layouts of Proximity
Proximity to Target Roads
The darker the values, the more suitable for the proposed quarantine centre to be constructed. Hence, this allows the accessibility of the transportation of the materials to construct the quarantine centre. With 5 metres by 5 metres resolution, the nearest road within the study area of Gombak is 0 metres. The furthest distance from the buildings is 743.303 metres.
Proximity to Buildings
The lighter the values, the more suitable for the proposed quarantine centre to be constructed. Hence, this is to ensure the quarantine centre to be built is staying away from the buildings. With 5 metres by 5 metres resolution, the nearest road within the study area of Gombak is 0 metres. The furthest distance from the roads is 838.466 metres.
Proximity to Target Natural Features
The lighter the values, the more suitable for the proposed quarantine centre to be constructed. Hence, this is to ensure the quarantine centre to be built is staying away from the nature features. With 5 metres by 5 metres resolution, the nearest road within the study area of Gombak is 0 metres. The furthest distance from the roads is 863.669 metres.
Slope
As mentioned earlier in first part of this Take Home Exercise, slopes are based on the elevation. The darker the values, the flatter the land is. Hence, the darker values are considered suitable for the quarantine centre to be constructed. With 30 metres by 30 metres resolution, the maximum steepness is approximately 36.419 degrees. As shown in the map, most areas of the study area are flat.
Part 3: Map Layouts of Criterion Scores
To standardize the criteria scores, I have used the min-max function. To get the minimum and maximum of the proximity layers, we can find out in the properties of the layers in the information section. The following shows an example of the minimum and maximum values of the proximity to roads layer.
Thereafter, I have applied the min-max formula ((DN-min value)/(max value – min value)) to get the standardized criterion score by using the Raster Calculator.
After standardization, the value is range from 0 to 1.
Accessibility Score
The Accessibility factor is to make sure that the site of the proposed quarantine centre is as close as possible to the roads. Hence, the lower the value the better.
Health Risk Score
The Health Risk factor is to make sure that the site of the proposed quarantine centre is as far as possible to the buildings. Hence, the higher the value the better.
Natural Conservation Score
The Natural Conservation factor is to make sure that the site of the proposed quarantine centre is far as possible to the natural sites. Hence, the higher the value the better.
Economic Score
The Economic factor is to make sure that the site of the proposed quarantine centre is at lower elevation of the slope. Hence, the lower the value the better.
Part 4: Analytical Hierarchical Process (AHP)
After standardization, the value is range from 0 to 1. Before computing AHP and to find out the suitability of building Communicable Disease Quarantine Centre, we have to decide criteria relevant to our goal which I have identified and arranged in the hierarchy illustrated in the above figure. This allows the incorporation and accommodation of both qualitative and quantitative criteria for assessing the suitability of building Communicable Disease Quarantine Centre. So, let’s start computing AHP.
AHP provides a framework where it helps us to prioritise on the different factors in decision making. It requires evaluation of the pair-wise comparison matrices using measurement theory. The parameter that is used to check this is called the Consistency Ratio. The consistency ratio is a measure of how much variation is allowed and must be less than 10%.
Based on my assumption of the analysis hierarchy figure, I have prioritised the factors in the following from top to bottom:
- Health Risk: People are greatest assets. Best is to prevent the disease spread to people living or working nearby, especially the military personnel
- Natural Conservation: Climate, environmental, and heritage issue
- Accessibility: Convenience for transporting patients and materials for building the centre
- Economic: A country with stable governance, money can be earned back.
I have constructed the AHP as follows and I got 7% of the consistency check which fulfills the criteria of the consistency ratio. This indicates that the comparisons of criteria were perfectly consistent. Moreover, I have also gotten the derived weights.
Part 5: Suitability Analysis
Based on the weights computed in AHP (which are equal to 1), we use Raster Calculator to calculate the suitability by applying the following formulas of using the criterion scores (Note: Both Economic Factor and Accessibility Factor need to be inverse):
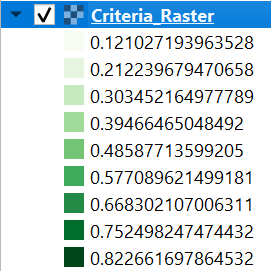
When visualized with single pseudocolour, the output is as follows:
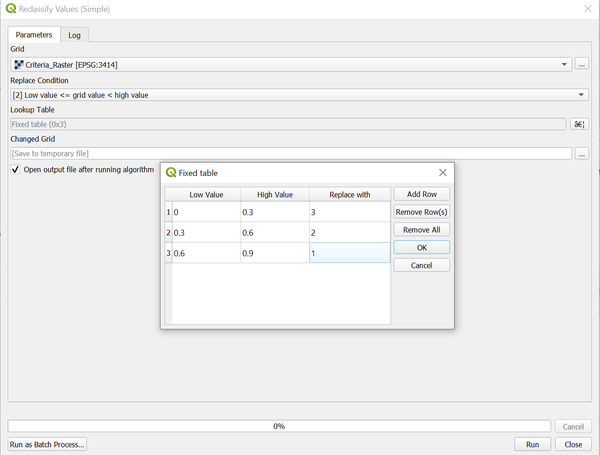
Hence, we will reclassify them into based on this condition by using Reclassify Values (simple):
|
Low Value |
High Value |
Replace with |
Remark |
|
0 |
0.31 |
3 |
Not Suitable Site |
|
0.31 |
0.49 |
2 |
Good Suitable Site |
|
0.49 |
0.85 |
1 |
Best Suitable Site |
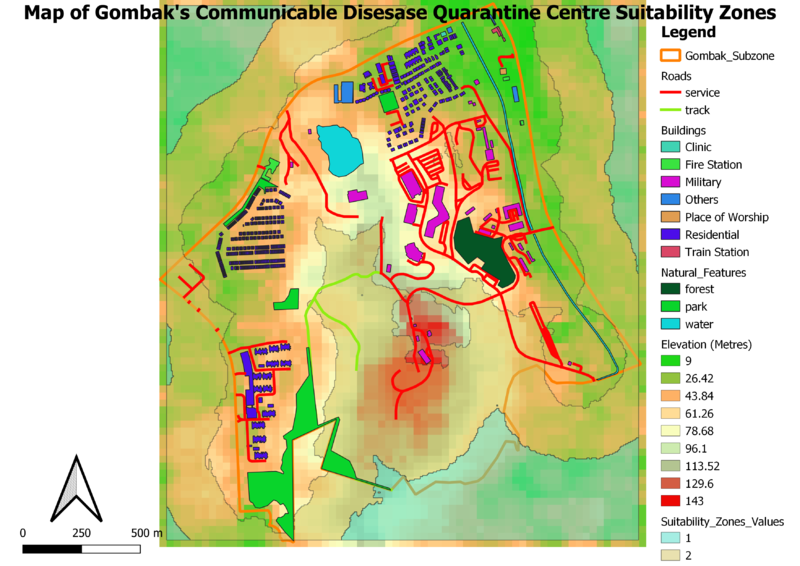
Thereafter, we visualise using single pseudocolour where the best suitable site (metric value of 1) is indicated by white zone and the good suitable site (metric value of 2) was indicated by the bright green pixels. Hence, the map is output as follows.
Next, we transform the suitability raster into a polygon using the Polygonize (raster to vector) function. Thereafter, we removed the metric value of 3 from the polygon’s attribute table as it is not a suitable site metric value.
Furthermore, it is considered as a valid location due to that it lies at the mid-steep areas of the elevation between 43m to 130m.
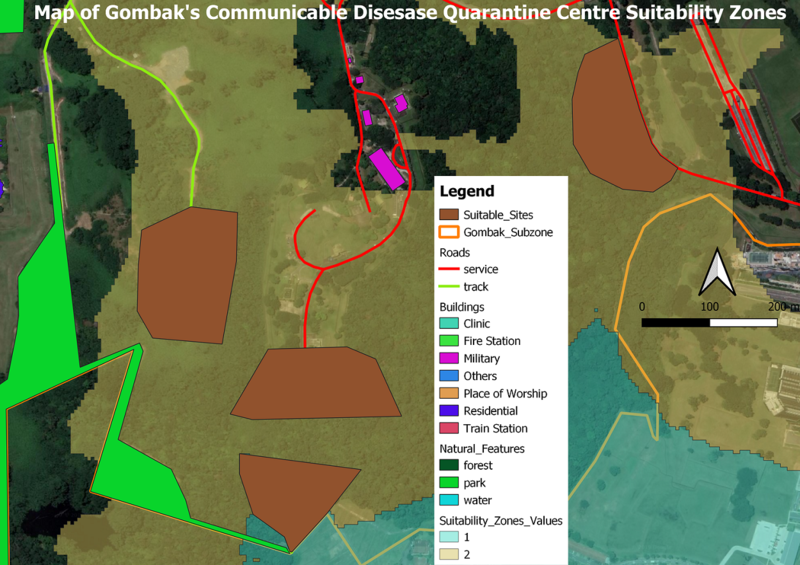
Hence, we will digitise suitable sites in the tint and pale orange regions where natural features, road accessibility and nearby houses which are outside Gombak subzone are taken into consideration in the following figure where it shows the zoomed overview of the are using Google Satellite base.
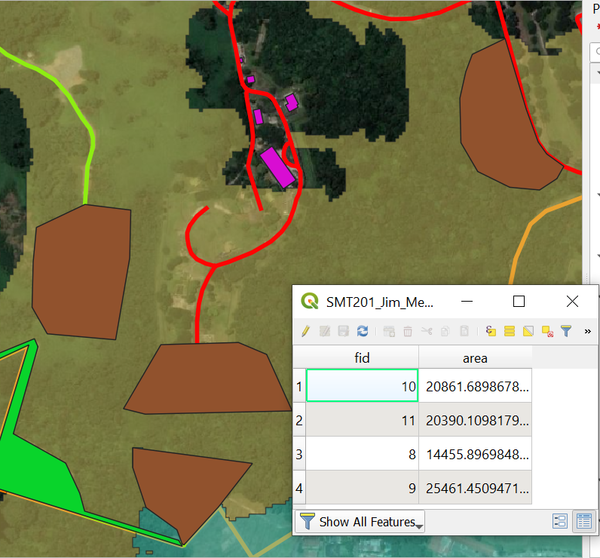
To get the area of the digitised areas, I have used $area in the suitable sites layer's attribute table's field calculator by creating a new field called area. The following figure shows the digitised suitable sites and its areas where they fulfilled the criteria of at least 10,000m2.
All the suitable sites are digitized in that way is because we can allow accessibility comes into play and maintain the natural conservation where we can link the road network to the proposed sites and construct the quarantine centre without affecting the natural feature (i.e. park). Furthermore, these suitable sites are staying away from buildings and are laying on the mid-level lands based on the elevation as explained earlier and in the following map.
In conclusion, I feel that the highlighted site (fid 9) is the most suitable site among all the 4 sites which has fulfilled at least 10,000m2 of contiguous area as shown in the figure below. This is because it stays away from buildings, the site did not touch on the park, it has road accessibility, and the elevation is mid-level.
Comments & Recommendations
In this Take Home Exercise 2, we can see that there is a challenge to build a quarantine centre in the Gombak subzone due to the fact that there is high elevation in the subzone and there are residential houses nearby together with natural features such as parks. Furthermore, Bukit Panjang camp takes mostly of the area of the subzone. This means that when building this quarantine centre, it means that:
- the communicable disease can affect to the people living nearby as well as the military personnel who are meant to defend our nation.
- natural conservation such as parks are highly affected as residents will use this as a part of recreation and animals who live in these areas will have no habitats to live in
All in all, building a quarantine centre in Gombak subzone will cause a hoo-ha in terms of environmental issue and society issue.
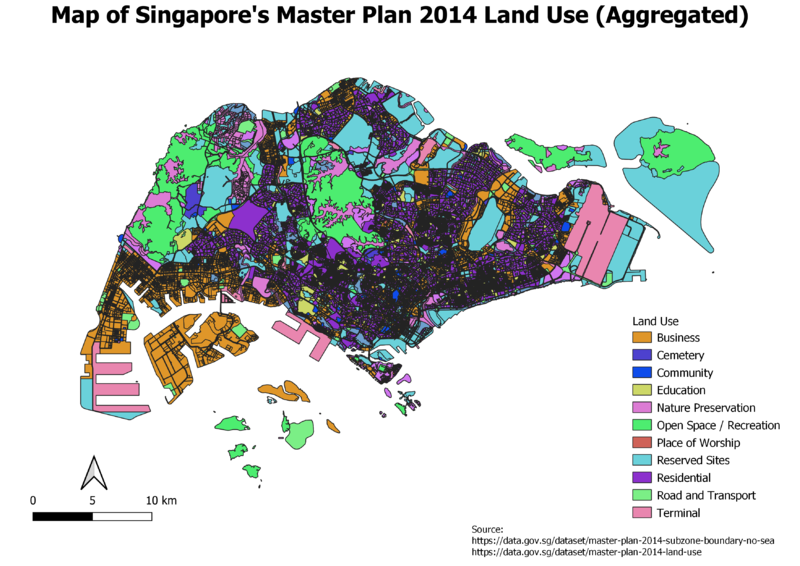
One recommendation for the building of quarantine centre is we can look into the Master Plan 2014 Land Use map. I have aggregated the types of land use due to overwhelming land use classifications provided by the raw data. From the map, we can see that, the western side of Singapore has a lot of open space and we shall look into that subzone later.
The subzone is Western Water Catchment where it has a lot of open space. For better analysis, we thereafter will only keep the land use classification which states open space, reserved sites, and nature preservation where open space and reserved sites allow us to find the suitable sites while nature preservation is for us to maintain natural conservation which is one of our factors.
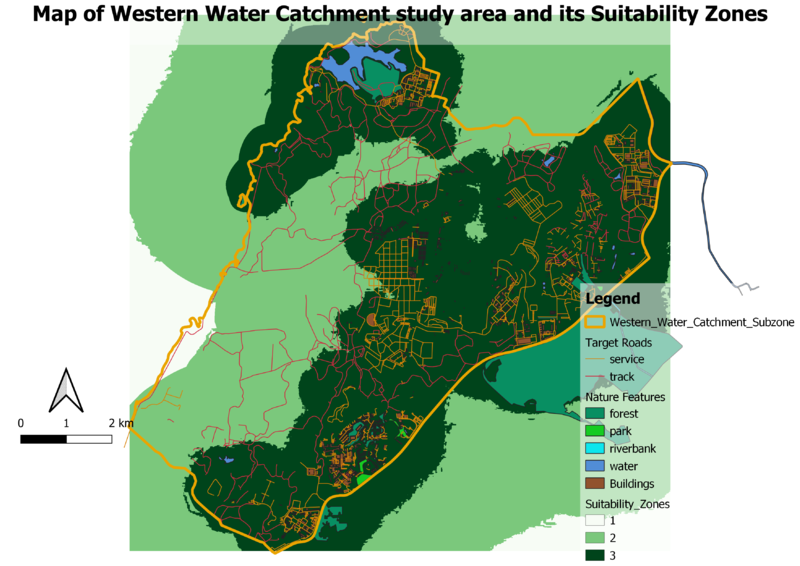
Thereafter, we shall add in target roads, buildings, and nature features into the subzone. Furthermore, we will look into the elevation as well.
From the two maps above, we can see that Western Water Catchment is a flat land subzone. Furthermore, there is high in accessibility and natural conservation factors and low in health risk factor in the north region and southwest region.
After standardizing the proximities, here is the composite map layout of the four factors. According to the criterion scores, blue colour represents the most suitable while red colour represents the least suitable in building the quarantine centre in the Western Water Catchment subzone. However, it seems that Western Water Catchment is in favor of accessibility and economic factor. Further analysis has to be done. As such, I will use the same AHP mentioned in this Take Home Exercise earlier.
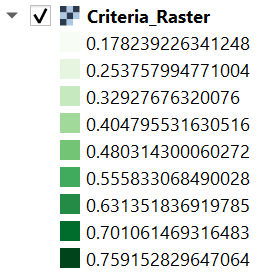
Thereafter, we compute the suitability by using the same weights given by the AHP mentioned in this Take Home Exercise which gives the following Criteria_Raster which I will reclassify them where value 3 is Not Suitable Site, 2 is Good Suitable Site, and 1 is Best Suitable Site.
As such, it gives the following map output where both Good Suitable Site (value 2) and Not Suitable Site (value 3) are in the study area of Western Water Catchment.
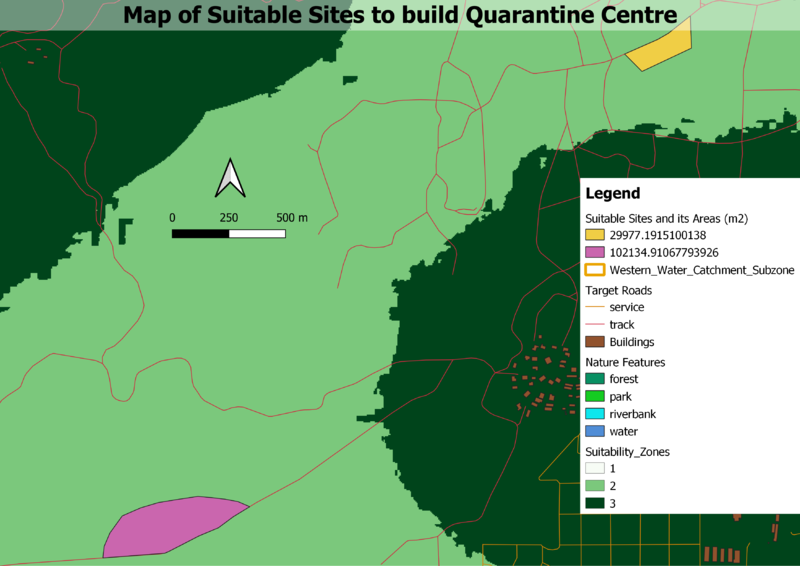
Hence, I will digitise the suitable sites at the north central region of the study area which has high accessibility. Moreover, as mentioned earlier, that area also has low health risk and its flat land with almost no natural features. The following map shows the digitized suitable sites with its areas which are at least 10,000m2.
Further view of the suitable sites in OpenStreetMap and Google Maps Satellite will be shown here.
In conclusion, Western Water Catchment is a suitable subzone as it has low elevation, very less nature features and buildings (especially residential buildings), and many target roads networks which fulfills our factors in building the quarantine centre. However, the land is currently used by Ministry of Defence (MINDEF) as it is used for SAFTI Live Firing Range. Hence, different government ministries such as MINDEF, Ministry of Health (MOH), and Ministry of National Development (MND) need to be involved in this proposal of building proposed quarantine centre by sacrificing a few land of the SAFTI Live Firing Range.
References
2014 Master Plan Subzone
2014 Master Plan Land Use
BBBike OSM Data
ASTER Global Digital Elevation Model (GDEM)
SCB Associates (AHP Template)
SAFTI Live Firing Area

