SMT201 AY2019-20T1 EX2 Renata Dharma
GIS Modelling for Urban Land Suitability Study
- The purpose of this exercise is to identify a location suitable for building a national Communicable Disease Quarantine Centre in Gombak.
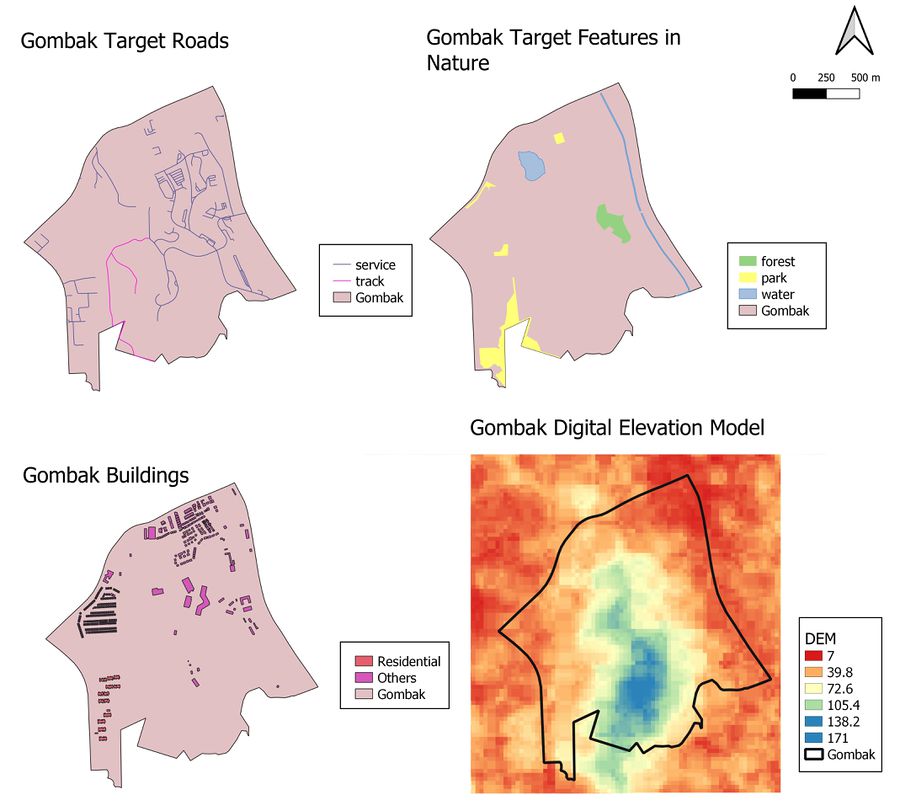
Step 1: Viewing the relevant features in Gombak
- Health risk factor: The selected site should be away from population i.e. housing areas and offices in order to avoid disease spreading to the nearby population. This can be obtained by categorizing the roads on the layer's symbology and then checking boxes for residential and others, which collectively selects places where the people may frequent i.e. places of workship, train station. No offices were found in Gombak, making the site slightly more deserted/ favourable.
- Natural conservation factor: The selected site should be away from forested land, park and water. Hence, by the same method above, only forests, parks and water bodies were selected.
- Accessibility factor: The selected site should be close to existing local roads, namely: service roads and tracks. This is to ensure easy transportation of building materials during the construction stage. This can be obtained by categorizing the roads on the layer's symbology and then checking boxes for service and tracks.
- Economic factor: The selected site should avoid steep slope. This is because construction at steep slope tends to involve a lot of cut-and-fill and will lend to relatively higher development cost. Hence, the digital elevation model for Gombak was extracted by clipping the original digital elevation model raster layer by the extent of Gombak.
Step 2: Determining proximity to relevant features in Gombak
- To determine proximity, each layer above must first be converted to a raster layer in order to later use the proximity tool [1] from GDAL. I first made a buffer of 1000m around Gombak, due to an edge effect that occurs upon using the proximity tool. Depending on the layer, the settings can be configured to the screen below:
For roads, it is better to use 10 by 10 resolution compared to 30 by 30 (default setting for this exercise) because the shape file for roads are lines and must be kept thin without losing its original path.
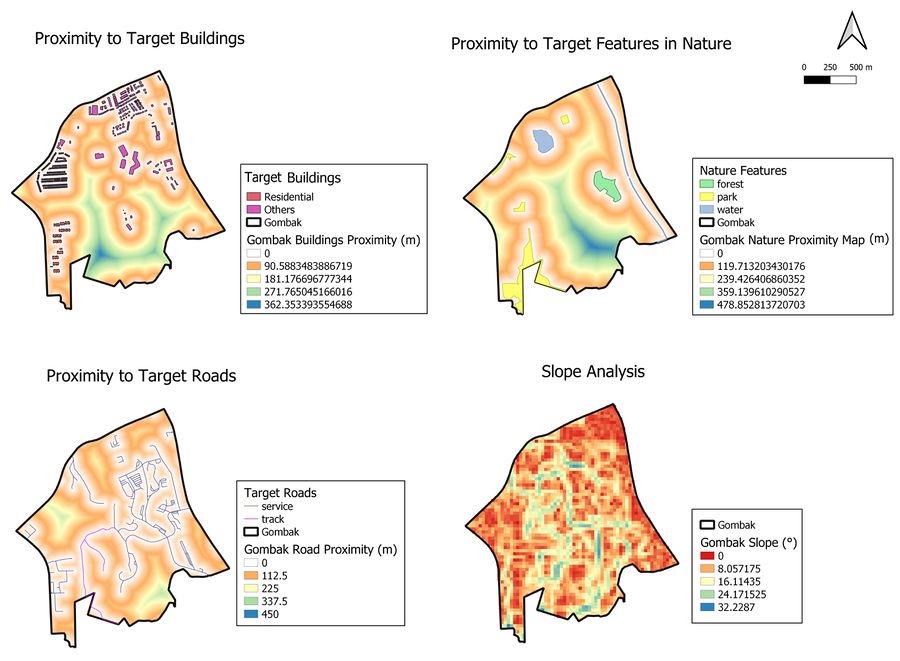
- Subsequently, we use the proximity tool from GDAL to run and compute individual layers (buildings, nature, roads) of proximity in metres. For slope, we must use the Slope tool from GDAL [2] and compute the Elevation Model in degrees.
Each category of feature (building, nature, roads, slope) were classified into 5 classes on a continuous scale. The resulting map are as follows:
Step 3: Ranking proximity of each relevant feature category in Gombak
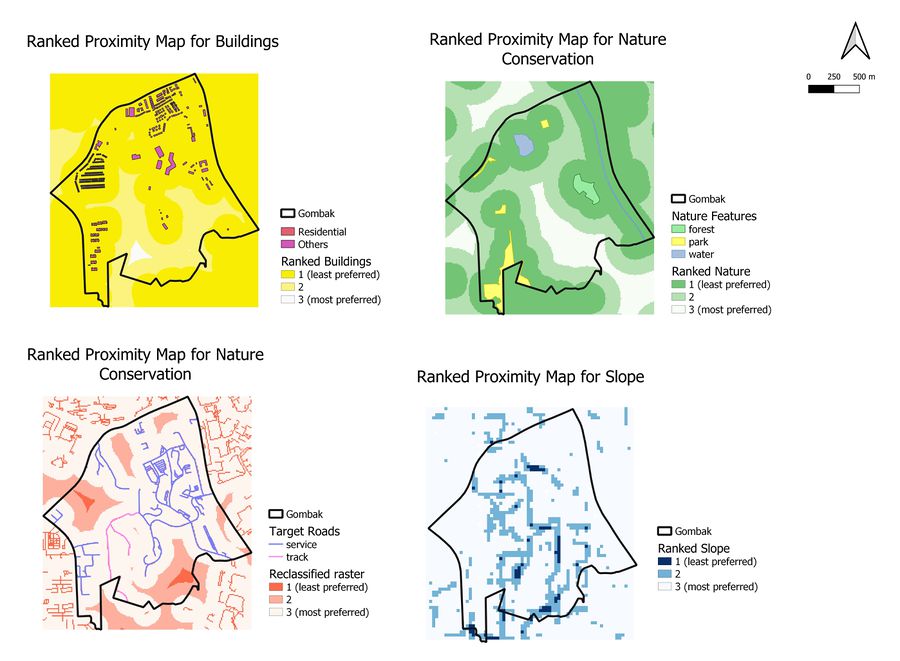
- After finding the distance from each feature, and height from ground to feature, one must rank the suitability of each part of Gombak. Thus, there is a need to reclassify the values obtained in Step 2.
- Health risk factor (Buildings): A national Communicable Disease Quarantine Centre should be at the very least 300 metres away from buildings and other facilities where citizens may frequently visit or use. Hence, the distances computed from the previous stepped are now ranked from 1 to 3, where the larger number indicates a greater preference. Here is an example of how proximity can be reclassified by table:
- Natural conservation factor (Nature): A national Communicable Disease Quarantine Centre should be at the very least 300 metres away from places of nature to avoid contaminating nature with any biologically enticed viruses.
- Accessibility factor (Roads): A national Communicable Disease Quarantine Centre should as close as 250 metres away from roads so that it is easier to bring someone into quarantine.
- Economic factor (Slope): A national Communicable Disease Quarantine Centre should be built on grounds that are as flat as possible, or at ground with less than 15° slope so that it is both easier and cheaper to construct the quarantine centre.
Bearing in mind these factors, the resulting map is as shows:
Step 3: Sorting importance of each factor in building the quarantine centre
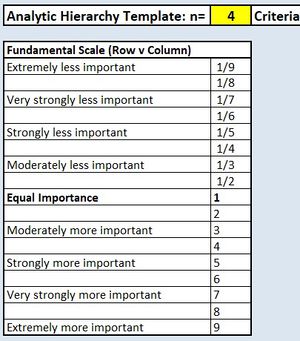
- With the help of the AHP Template provided by SCB Associates, I am able to rank the importance of the Health Risk, Natural Conservation, Accessibility and Economic factors relative to each of them.
These were the values I provided for each factor, by referring to the scale provided:
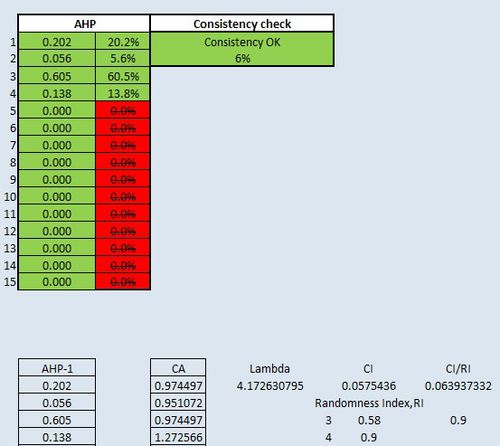
The file will automatically weigh each factor against another, to check if the paired comparisons are consistent.
The results show:
- Economic Factor: 0.202
- Accessibility Factor: 0.056
- Health Risk Factor: 0.605
- Natural Conservation Factor: 0.138
Personally, the health risk factor is the most important because it is the main reason why the quarantine centre is set up for, hence it is only natural that this factor be given the highest weight.
References
[1] Master Plan 2014 Subzone Boundary from URA. This data can be downloaded from data.gov.sg. [3]
[2] Roads, buildings and natural features data from OpenStreetMap (OSM) data sets. [4]
[3] ASTER Global Digital Elevation Model (GDEM) dataset jointly prepared by NASA and METI, Japan. [5]
