SMT201 AY2019-20T1 EX2 Tan Jie Ting Christine Suitability
|
Suitability |
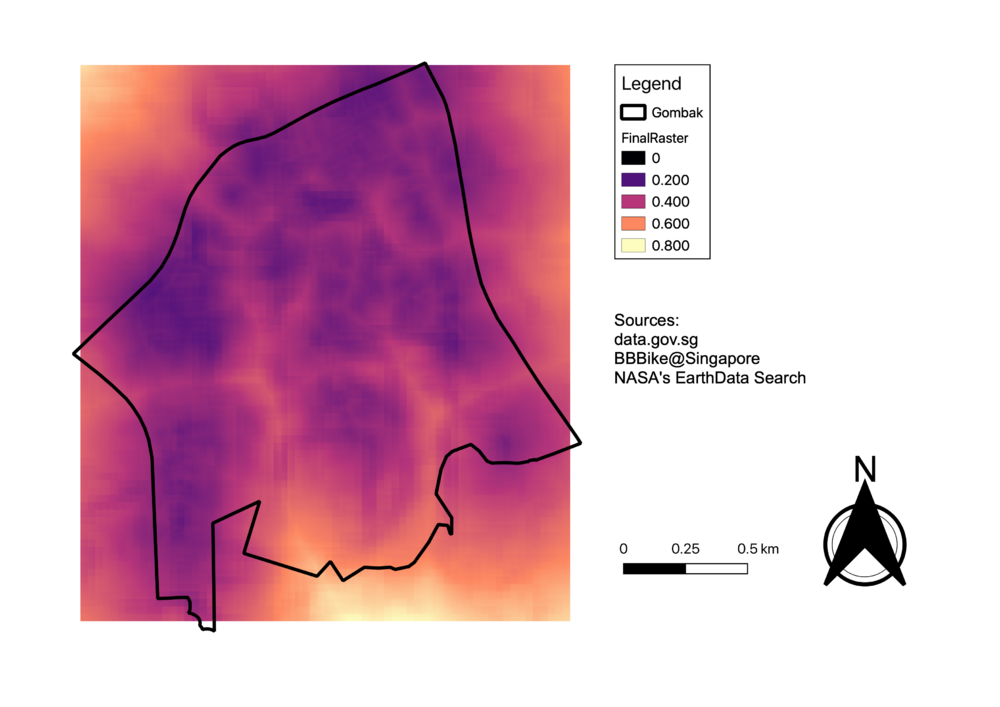
Raster Map
To obtain this raster map, I inputted the weights that were chosen in the previous step, AHP, into the raster calculator function in QGIS. The formula inputted is at follows:
"NormalisedRoads@1" * 0.200 + "NormalisedBuildings@1" * 0.635 + "NormalisedNatural@1" * 0.061 + "NormalisedSlope@1" * 0.105
Reclassified Raster Map
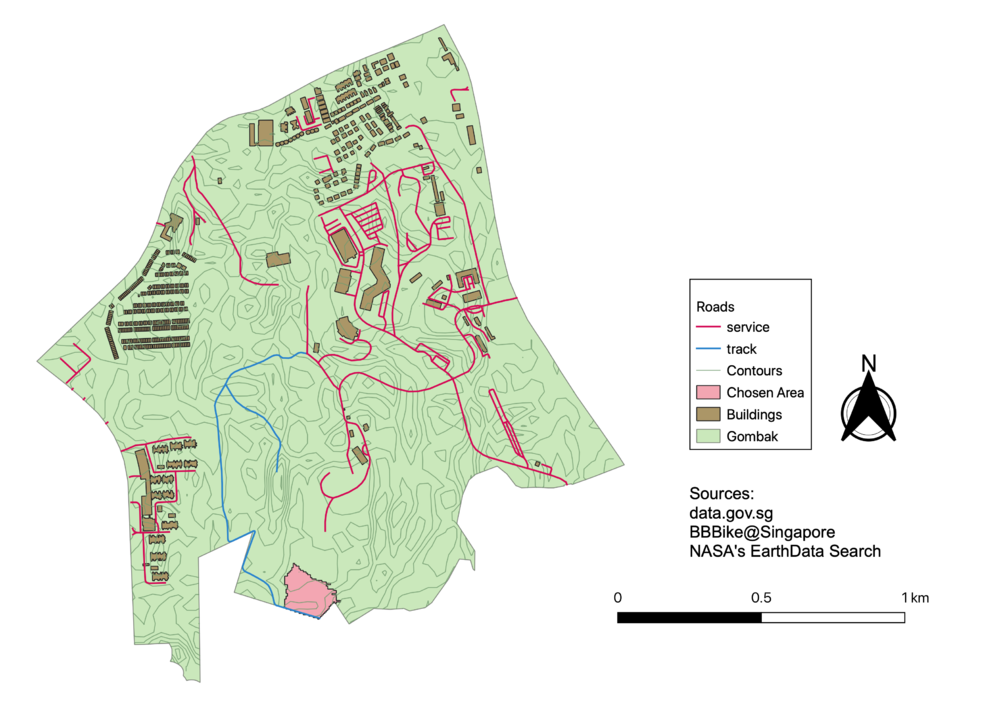
From the above raster map, I decided to determine areas that I would use with a score of more than 0.60. With that, I performed "Reclassify by Table" to find the areas that have met that criteria. The output is as seen below:
Conclusion
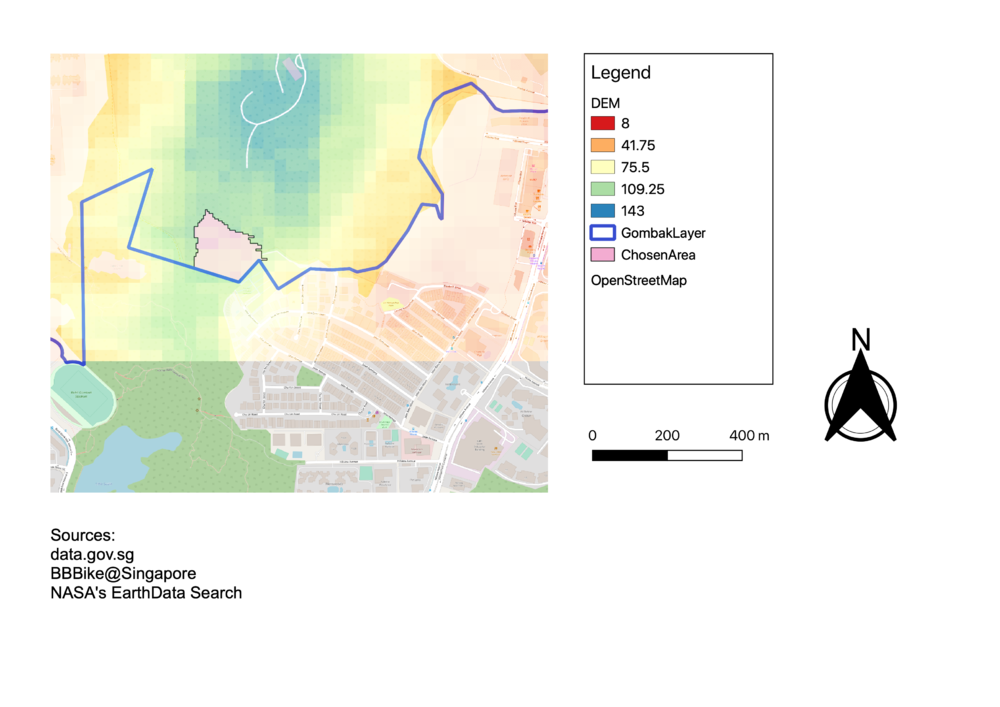
After evaluating the two areas, only one of the areas had an area that was more than 10,000m2, and hence I chose this area to build the national Communicable Disease Quarantine Centre. This selected area has an area of 21667m2.


