SMT201 AY2019-20T1 EX2 Soh Bai He
Objective
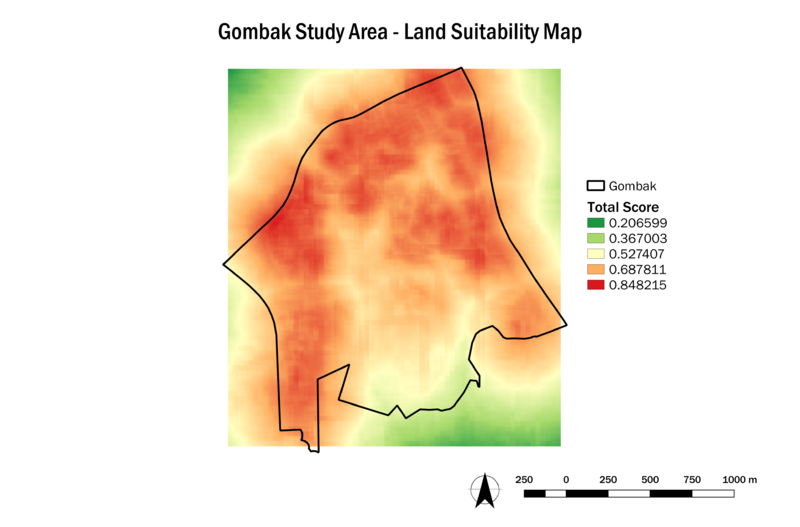
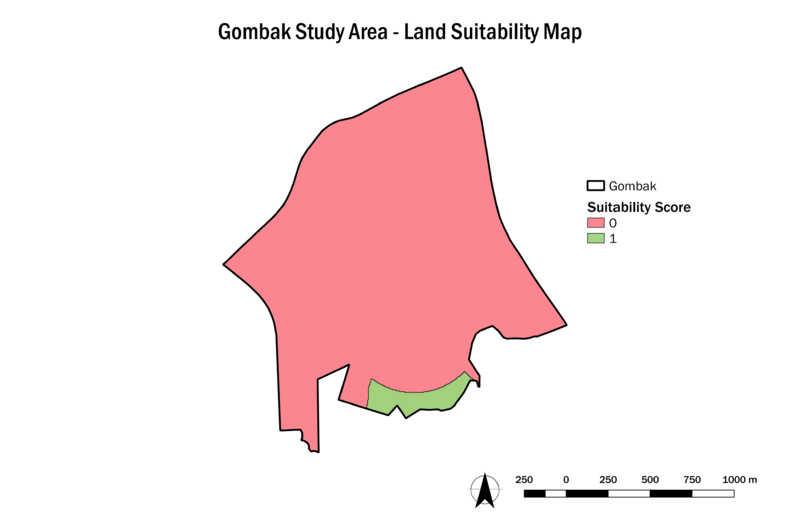
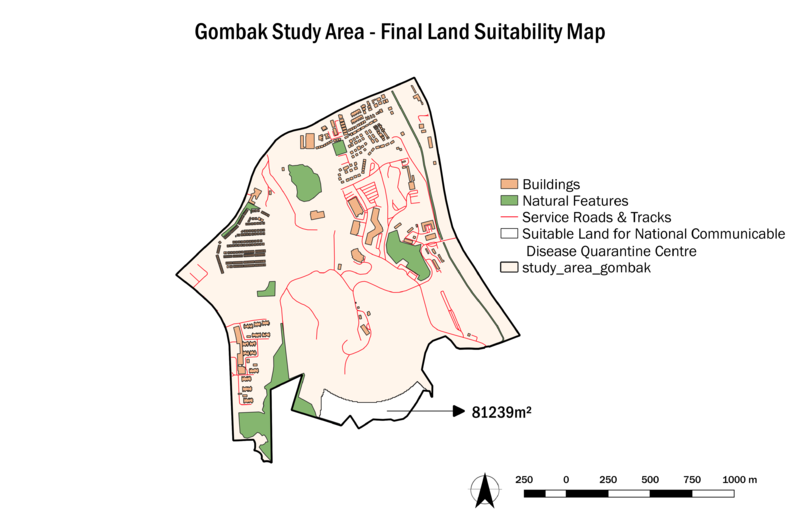
To identify a location in Gombak planning subzone that is suitable for building a National Communicable Disease Quarantine Centre, the following decision factors are studied in this report:
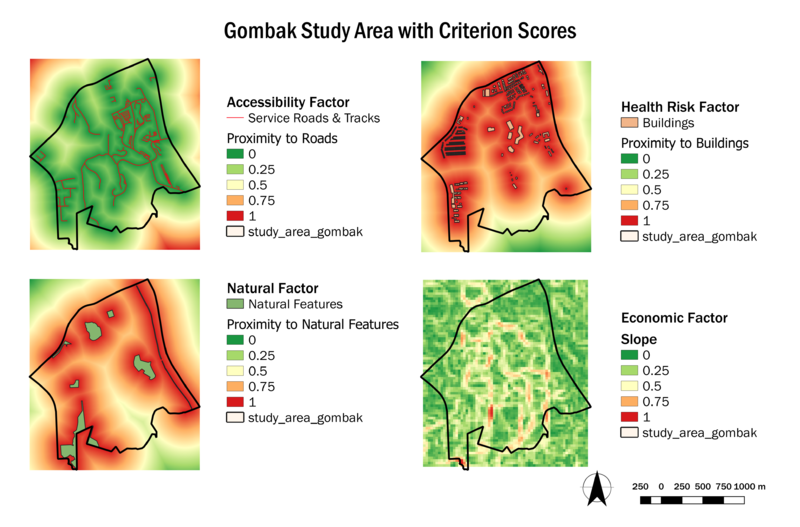
1. Accessibility Factor: The selected site should be close to existing service roads and tracks, to ensure the ease of transportation of resources during the construction of the Centre.
2. Health Risk Factor: The selected site should be away from the population in order to avoid the spread of the disease.
3. Natural Conservation Factor: The selected site should be away from forested land, park and water.
4. Economic Factor: The selected site should avoid steep slope to as it involves a lot of cut-and-fill which would lead to relatively higher development cost.
Data Source
| Name | Format | Source |
|---|---|---|
| Master Plan 2014 Subzone Boundary (No Sea) | shapefile | data.gov |
| Roads, Buildings, Natural | shape | OpenStreetMap |
| ASTER DEM | Raster | NASA |
Features of Interest
Accessibility Factor (Roads)
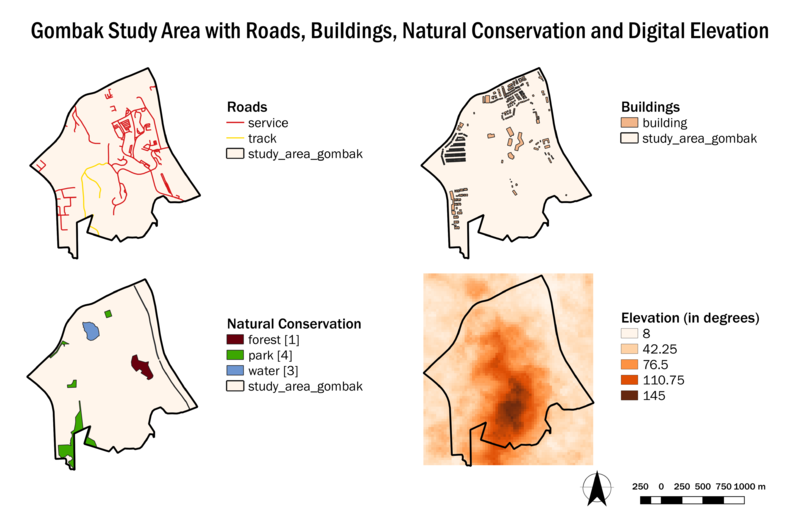
Service roads and tracks are of concern for our analysis. Hence, they are extracted from OSM roads data. They are concentrated in the north and east areas of Gombak. Overall, road network in Gombak is sparse.
Health Risk Factor (Buildings)
All buildings are treated as population indicators. In general, the Centre should be kept away and isolated from all buildings. Therefore, classifying buildings will not be meaningful for our analysis. It can be observed that the southern area of Gombak is lacking buildings.
Natural Conservation Factor (Natural Features)
There are 1 forest, 4 parks and 3 waterbodies identified.
Economic Factor (Elevation)
The lowest point in Gombak is 8 degrees above sea level, while the highest point is 145 degrees. Natural features are located within the low-lying areas of Gombak while the highest point of elevation can be observed in the southern area of Gombak.
Proximity Analysis
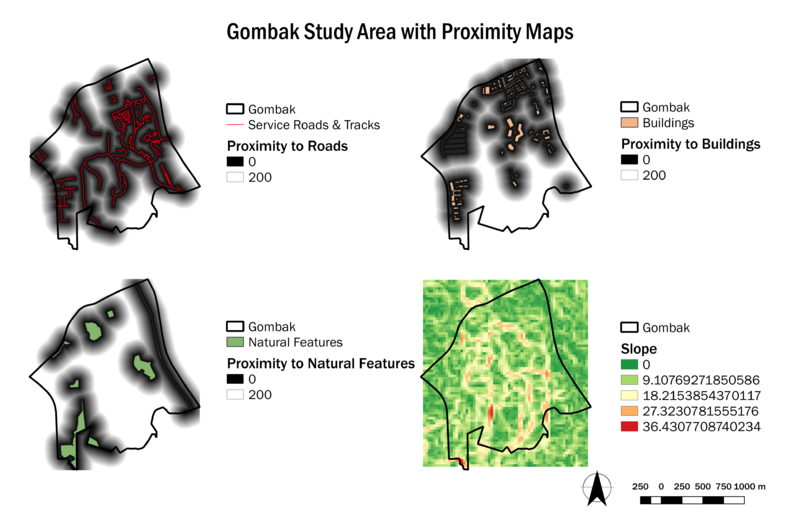
Before land suitability analysis is conducted to select a suitable land for the Centre, a proximity analysis is necessary to display the closeness of land lots in Gombak to the features related to each decision factor. The proximity maps are standardized to show the proximity range of 0 to 200m to ensure uniformity in comparison.
Proximity to Roads
The areas in black are closer to service roads and tracks. They are more suitable for the building of the Centre as they indicate higher accessibility. The proximity from roads to a piece of 5m² land varies from 0 to 717.025m.
Proximity to Buildings
The areas in white are further away from the buildings. They are more suitable for the building of the Centre as they are further away from the population which would pose lesser health risk to the population. The proximity from buildings to a piece of 5m² land varies from 0 to 816.364m.
Proximity to Natural Features
The areas in white are further away from natural features. They are more suitable for the building of the Centre as it would reduce damage to natural features and animals. The proximity from natural features to a piece of 5m² land varies from 0 to 848.116m.
Slope
The areas in green do not have steep slopes. They are more suitable for the building of the Centre as it would reduce cost. The steepness of the slope varies from 0 to 36.4308 degrees.
