SMT201 AY2019-20T1 EX2 Renata Dharma
Contents
GIS Modelling for Urban Land Suitability Study
The purpose of this exercise is to identify a location suitable for building a national Communicable Disease Quarantine Centre in Gombak.
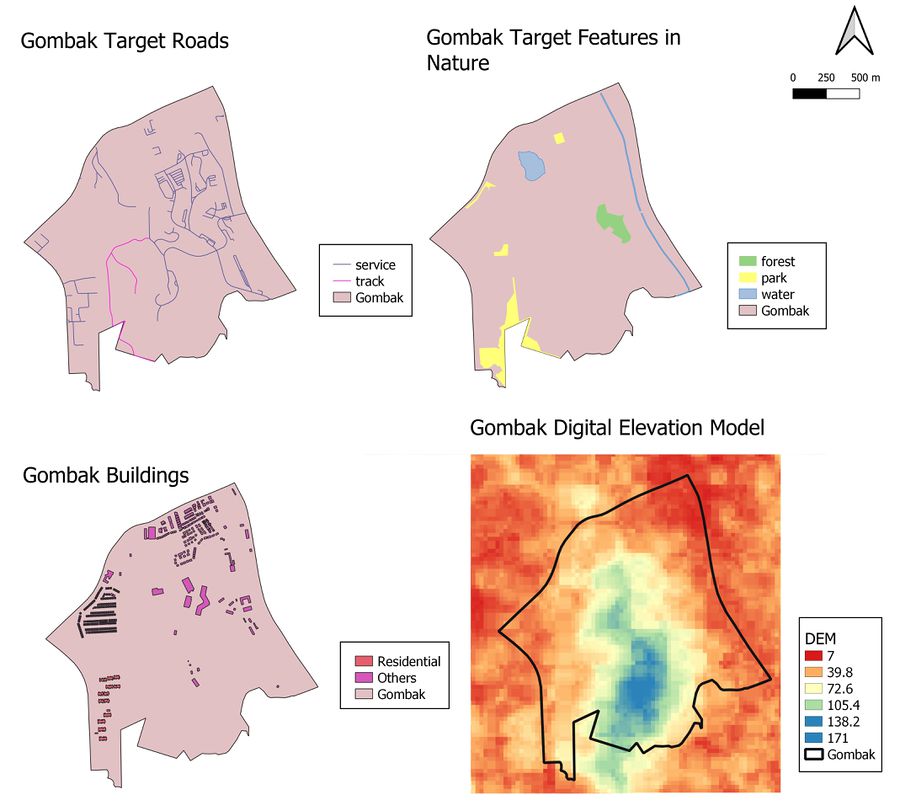
Step 1: Viewing the relevant features in Gombak
Health risk factor: The selected site should be away from population i.e. housing areas and offices in order to avoid disease spreading to the nearby population. This can be obtained by categorizing the roads on the layer's symbology and then checking boxes for residential and others, which collectively selects places where the people may frequent i.e. places of workship, train station. No offices were found in Gombak, making the site slightly more deserted/ favourable.
Natural conservation factor: The selected site should be away from forested land, park and water. Hence, by the same method above, only forests, parks and water bodies were selected.
Accessibility factor: The selected site should be close to existing local roads, namely: service roads and tracks. This is to ensure easy transportation of building materials during the construction stage. This can be obtained by categorizing the roads on the layer's symbology and then checking boxes for service and tracks.
Economic factor: The selected site should avoid steep slope. This is because construction at steep slope tends to involve a lot of cut-and-fill and will lend to relatively higher development cost. Hence, the digital elevation model for Gombak was extracted by clipping the original digital elevation model raster layer by the extent of Gombak.
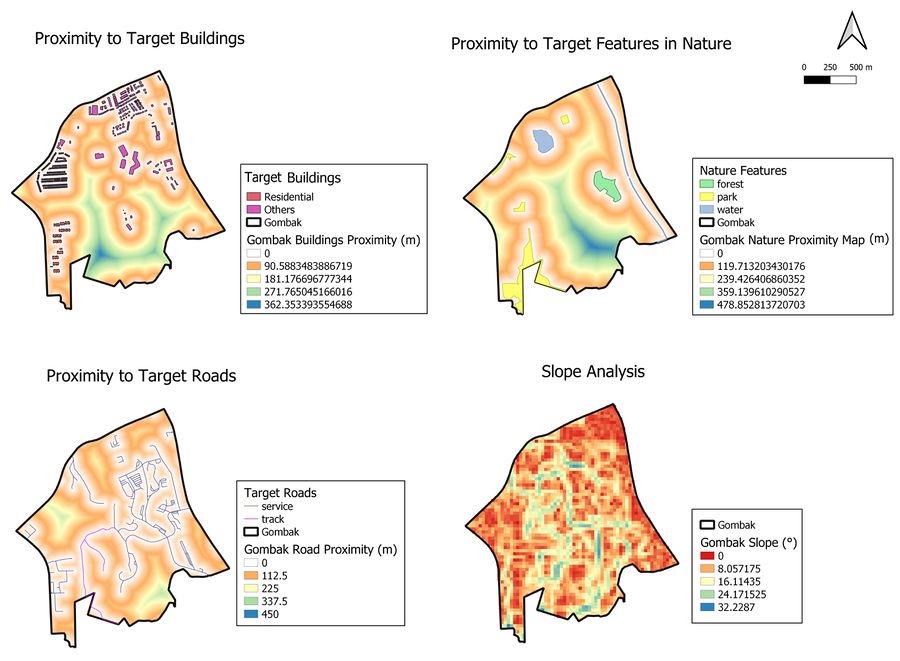
Step 2: Determining proximity to relevant features in Gombak
To determine proximity, each layer above must first be converted to a raster layer in order to later use the proximity tool [1] from GDAL. I first made a buffer of 1000m around Gombak, due to an edge effect that occurs upon using the proximity tool. Depending on the layer, the settings can be configured to the screen below:
Subsequently, we use the proximity tool from GDAL to run and compute individual layers of proximity in metres. Each category of feature (building, nature, roads, slope) were classified into 5 classes on a continuous scale. The resulting map are as follows:
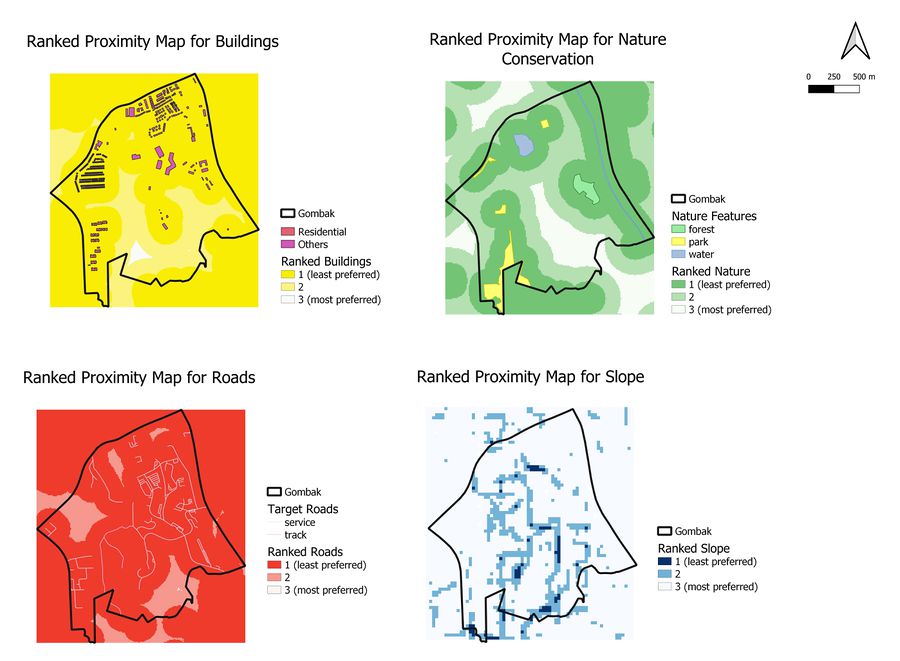
Step 3: Ranking proximity of each relevant feature category in Gombak
References
[1] Master Plan 2014 Subzone Boundary from URA. This data can be downloaded from data.gov.sg. [2]
[2] Roads, buildings and natural features data from OpenStreetMap (OSM) data sets. [3]
[3] ASTER Global Digital Elevation Model (GDEM) dataset jointly prepared by NASA and METI, Japan. [4]


