SMT201 AY2019-20G1 Ex2 Luo Junru
The objective is to identify a location suitable for building a national Communicable Disease Quarantine Centre at the Gombak planning subzone. In order to examine potential site suitability, 4 factors are taken into consideration:
1. Economic:
Steep slope should be avoided because it is rather expensive to build a site there as compared to a flat ground.
2. Accessibility:
The site should be closer to roads to facilitate the construction process.
3. Health risk factor:
The site should be away from buildings to prevent the disease from spreading to the population.
4. Natural conservation factor:
The site should be away from natural areas because natural sites are usually far away from roads, thus if the site is near natural areas, it may be inaccessible also.
The data used for this assignment are retrieved from the following websites:
• Master Plan 2014 Subzone Boundary from data.gov.sg.
• Roads, buildings and natural features data from OpenStreetMap (OSM) via BBBike@Singapore.
• ASTER Global Digital Elevation Model (GDEM) dataset jointly prepared by NASA and METI, Japan from NASA’s EarthData Search site.
Part 1
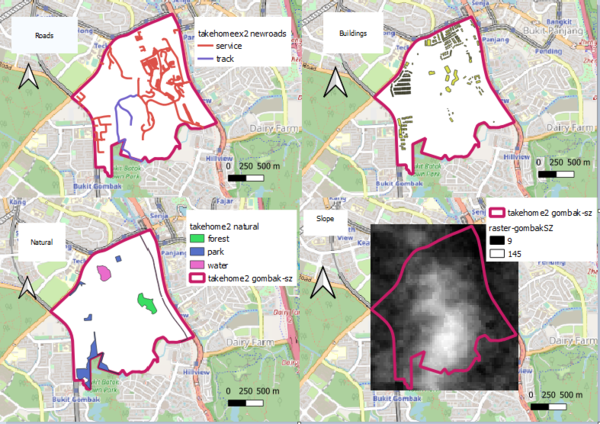
Target roads, buildings, target natural features and digital elevation
The above picture includes 4 maps showing the distribution of roads, buildings, natural areas and slope digital elevation. Generally, the eastern side of Gombak have denser road networks. The buildings are concentrated mainly at the north of Gombak, so the site could possibly be built at the Southern part of Gombak. Natural features are spread out across Gombak, except the central and Southern parts. The slope steepness varies across the Gombak area.
Part 2
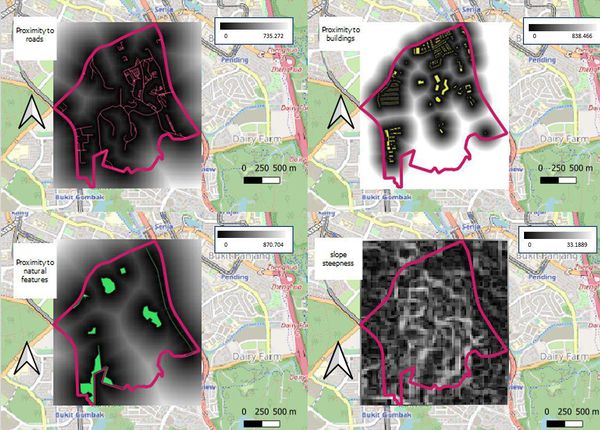
Proximity analysis
The above picture shows 4 maps analysing the proximity from various features. From the first map, most of the Gombak area are near road networks, especially the Central South and the Eastern parts. From the second map, buildings in Gombak are mostly concentrated at the northern part of Gombak and the Southern part is far from buildings. From the third map, mainly the Southern part of Gombak is far from the natural features. From the last map, the slope steepness is generally well spread out. Since the analysis in front support the site to be built at the Southern part of Gombak, we can study specific areas there where the slope is less steep.
Part 3
Criterion scores
I standardized the scores for each of the proximity layers based on the 4 criteria. This is because the 4 layers have different ranges of proximity distances. By standardizing them, it will ensure a fairer comparison. This is done by performing min-max calculation with the raster calculator. The formula for min-max standardization is as follows:
(Reference: Prof Kam’s Lesson 9: GIS Modelling for Urban Planning Support ppt notes)
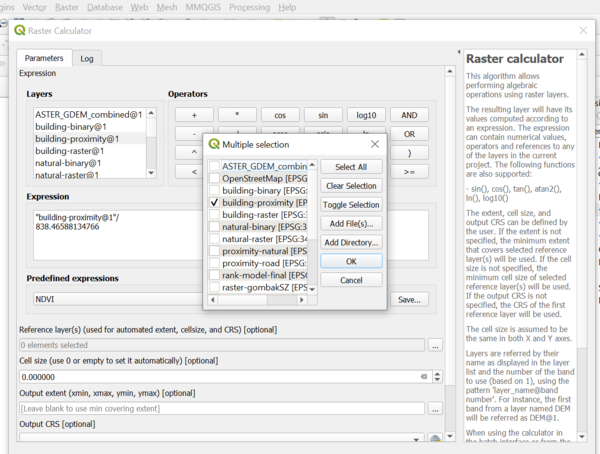
An example is shown below to produce the standardized proximity layer for buildings. Since the minimum distance is 0, it is omitted in my calculation below.
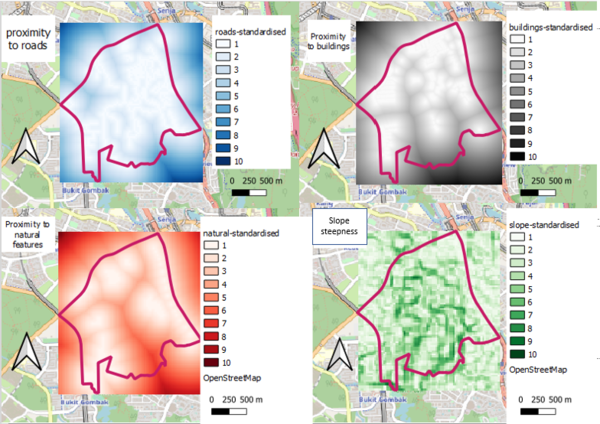
The above picture shows 4 maps of the standardized proximity from various features and the steepness of the slope. After standardizing, the scores will range from 0 to 1. However, for presentation I adjusted them to blocks of 10 of equal interval classification. Therefore, for values <=0.1, I will label them as 1, for 0.1-0.2 it will be 2, for 0.2-0.3 will be 3 and so on until it hits 10.
For the map on buildings, the Southern part of Gombak is the furthest away from buildings so it supports our findings in front on the Southern part possibly being a suitable place to build the site. Moreover, the third map on natural features also support this with the Southern part of Gombak having the highest scores, meaning it is the furthest from natural features. Looking at the Southern part of Gombak from the last map, the area closer to the border is less steep. Overall, a possible area to build the site could be at the Southern part of Gombak and near the border.
Part 4
Analytical Hierarchical Process input matrix
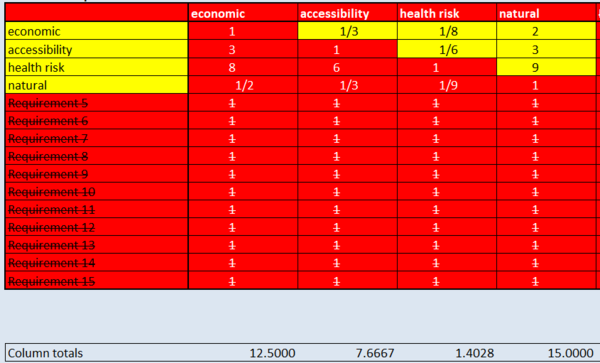
The above screenshot shows the analytic hierarchy process. In this case, accessibility is more important than economic but their difference in terms of importance is also not very big so I put 1/3. By being inaccessible, it may result in higher economic costs as well in terms of transporting building materials. Health risk is a lot more important than all the other factors as it is the main concern of the centre since it is related to health of the people. This explains the fraction of 1/8 and 1/6. Natural features is not much of a concern as compared to other factors because it does not affect the daily process of the centre and the population as much as the other factors. This explains why under natural all the numbers are whole numbers instead of fractions.
After finishing the matrix, the consistency is less than 10%, which means the matrix is good to continue. Overall, the most important factor is health risk (0.684) , followed by accessibility (0.172), then economic (0.086) and natural (0.057).
Part 5
Suitability land lot for building a national Communicable Disease Quarantine Centre
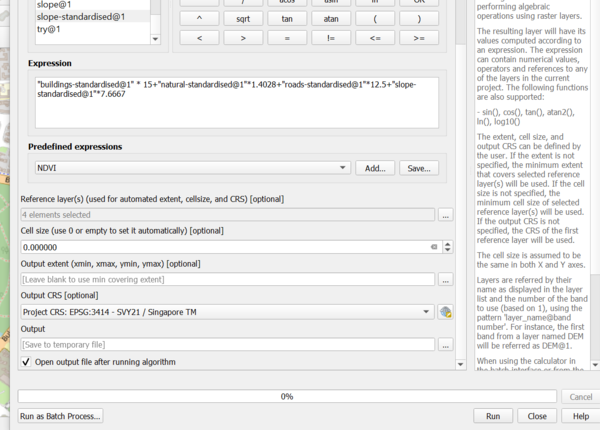
From the values shown at the columns total from the above screenshot from the Analytical Hierarchy Process, we can use the raster calculator to produce the overall model for the land suitability as shown from the screenshot below.
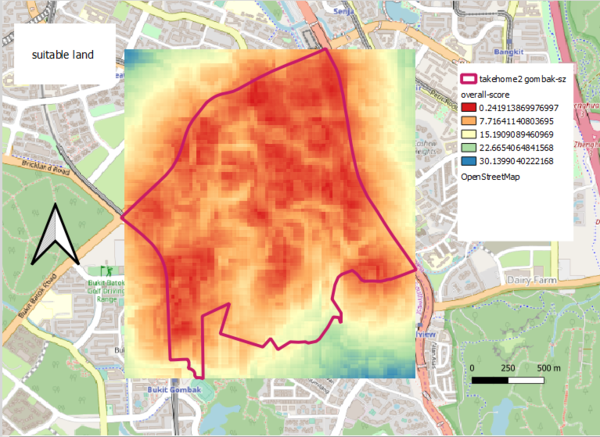
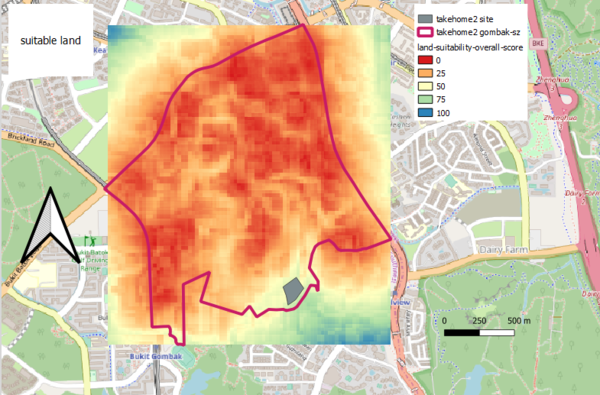
The output will be the overall-score layer as shown below.
After this, I created a new layer and I drew out a polygon at the Southern part of Gombak based on the overall highest score area.
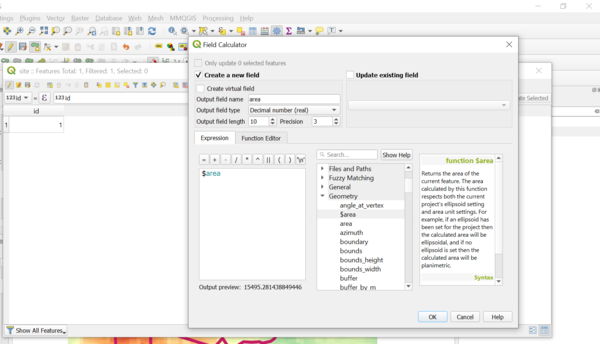
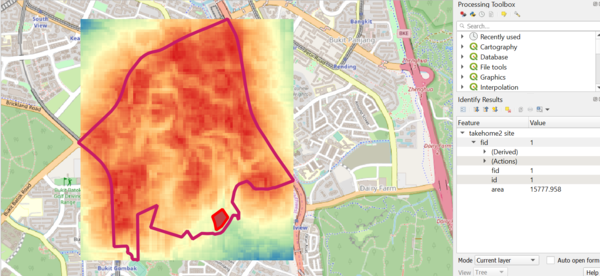
Therefore, this new layer will contain 2 columns of id and area, of which I specified id to be a whole number but area to have decimal places.
I converted the scores to be out of 100 for better visualisation. This is done by taking the “overall-score@1” minus the minimum score for the overall-score layer then divide by the maximum and minimum score from the overall-score layer.
I went on to check if that area fits the criteria of more than 10,000m^3, which it did in this case as shown on the screenshot above. Hence the site area proposed can be the actual area to build the site as it has the highest score overall from the overall-score layer and also fits the criteria of the area size. Moreover, the shape is not odd, making it wide and long enough to build a building there.
Despite this, there are limitations. For instance, if there are buildings from another subzone near the Southern border of Gombak, the site may not be suitable after all. In addition, other factors such as soil suitability may affect the site selection as well. For instance, if the soil has poor bearing pressure, the centre cannot be built there.
However, these factors are outside the scope of this assignment as we are mainly focusing on the 4 factors and the Gombak area only.
