Uncategorised files
Jump to navigation
Jump to search
Showing below up to 50 results in range #2,681 to #2,730.
View (previous 50 | next 50) (20 | 50 | 100 | 250 | 500)
 Toc2.jpg 277 × 40; 4 KB
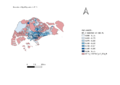
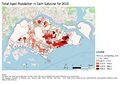 Total Aged Population in Each Subzone for 2010 without labels.jpg 3,507 × 2,480; 841 KB
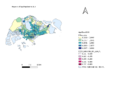
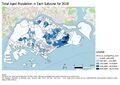 Total Aged Population in Each Subzone for 2018 without labels.jpg 3,507 × 2,480; 838 KB
 Total Criteria Scores.jpg 2,104 × 1,488; 207 KB
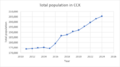 Total population in cck.png 612 × 344; 18 KB
 Tpyishun.jpg 708 × 419; 38 KB
 TradeArea.png 3,293 × 1,876; 526 KB
 Train Travel.jpg 3,507 × 2,480; 1,024 KB
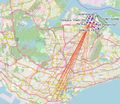 Train Travel zoomed.jpg 1,270 × 1,103; 366 KB
 Transformation matrix.png 1,366 × 361; 73 KB
 Transport.png 724 × 403; 35 KB
 Travelling pattern cck.jpg 889 × 522; 81 KB
 Two thousand eighteen.jpg 2,338 × 1,652; 439 KB
 Two thousand ten.jpg 2,338 × 1,652; 443 KB
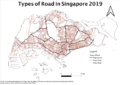 Type of Road.png 1,706 × 1,204; 1.23 MB
 TzyAboveandequal65(2010.png 1,843 × 1,126; 239 KB
 TzyLanduse.png 800 × 565; 125 KB
 TzyMorethan65('18').png 800 × 565; 101 KB
 TzyProportion(2010).png 800 × 565; 74 KB
 TzyProportion(2018).png 800 × 565; 80 KB
 TzyRoadnetwork.png 1,530 × 698; 529 KB
 Tzy change.png 3,507 × 2,480; 741 KB
 Unclippedfinalraster.png 829 × 770; 325 KB
 Untitled.jpg 1,017 × 721; 334 KB
 Update gombakPart3.png 1,338 × 1,004; 449 KB
 Updated gantt chart.png 1,120 × 688; 56 KB
 Updated project timeline.png 2,483 × 1,750; 454 KB
 UrbanGIS.jpg 600 × 432; 127 KB
 Values.png 403 × 369; 12 KB
 Vector.jpeg 4,960 × 3,507; 1.84 MB
 Vector22.jpeg 4,960 × 3,507; 1.89 MB
 Vector2222.jpeg 4,960 × 3,507; 1.83 MB
 Vector4.jpg 3,507 × 2,480; 560 KB
 Vector Format.png 3,507 × 2,480; 768 KB
 Vectorfinal.jpeg 4,960 × 3,507; 1.94 MB
 Vectorfinalfinal.jpeg 4,960 × 3,507; 1.85 MB
 Vectorised.jpeg 3,507 × 2,480; 355 KB
 Vectorized land suitability NXJ.jpeg 3,507 × 2,480; 938 KB
 Vectorized land suitability final NXJ.jpeg 3,507 × 2,480; 950 KB
 Vectorizedjan.png 3,507 × 2,480; 131 KB
 Vectorlast.jpeg 4,960 × 3,507; 1.9 MB
 Virtual Layer.png 939 × 1,091; 112 KB
 Virtual Layer Aggregation.png 977 × 1,105; 140 KB
 Virtual Layer Aggregation2.png 941 × 1,099; 91 KB
 Visual analysis Elevation.jpg 2,500 × 1,767; 196 KB
 Visual analysis accessibility factor.jpg 2,500 × 1,767; 220 KB
 Visual analysis health risk factor.jpg 2,500 × 1,767; 129 KB
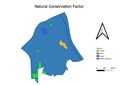 Visual analysis natural.jpg 2,500 × 1,767; 148 KB
 WYJ Road Network.png 700 × 434; 239 KB
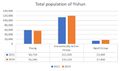
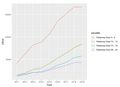 Waterway east pop graph.jpg 1,158 × 836; 60 KB


.png)
.png)
.png)


