File list
Jump to navigation
Jump to search
This special page shows all uploaded files.
| Date | Name | Thumbnail | Size | User | Description | Versions |
|---|---|---|---|---|---|---|
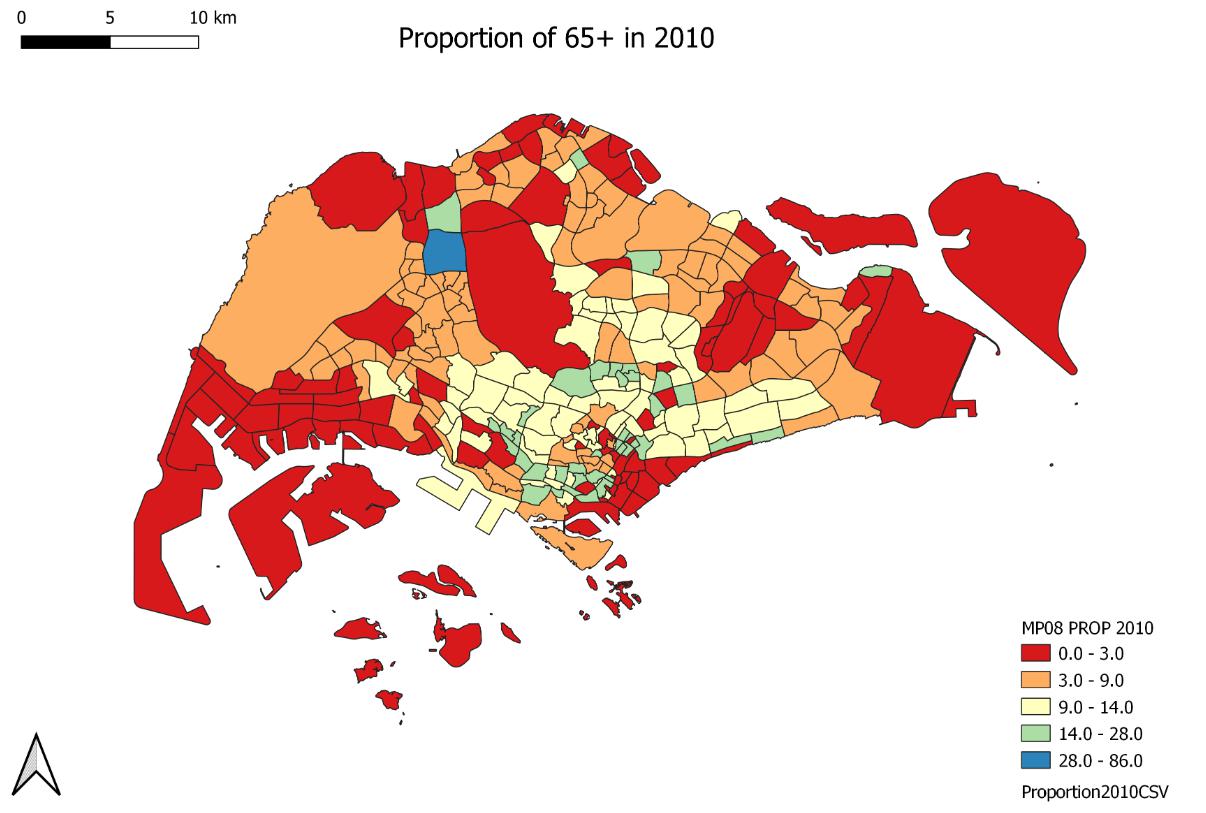
| 17:25, 15 September 2019 | 2010 proportion.jpg (file) |  |
98 KB | Vanessa.au.2018 | 1 | |
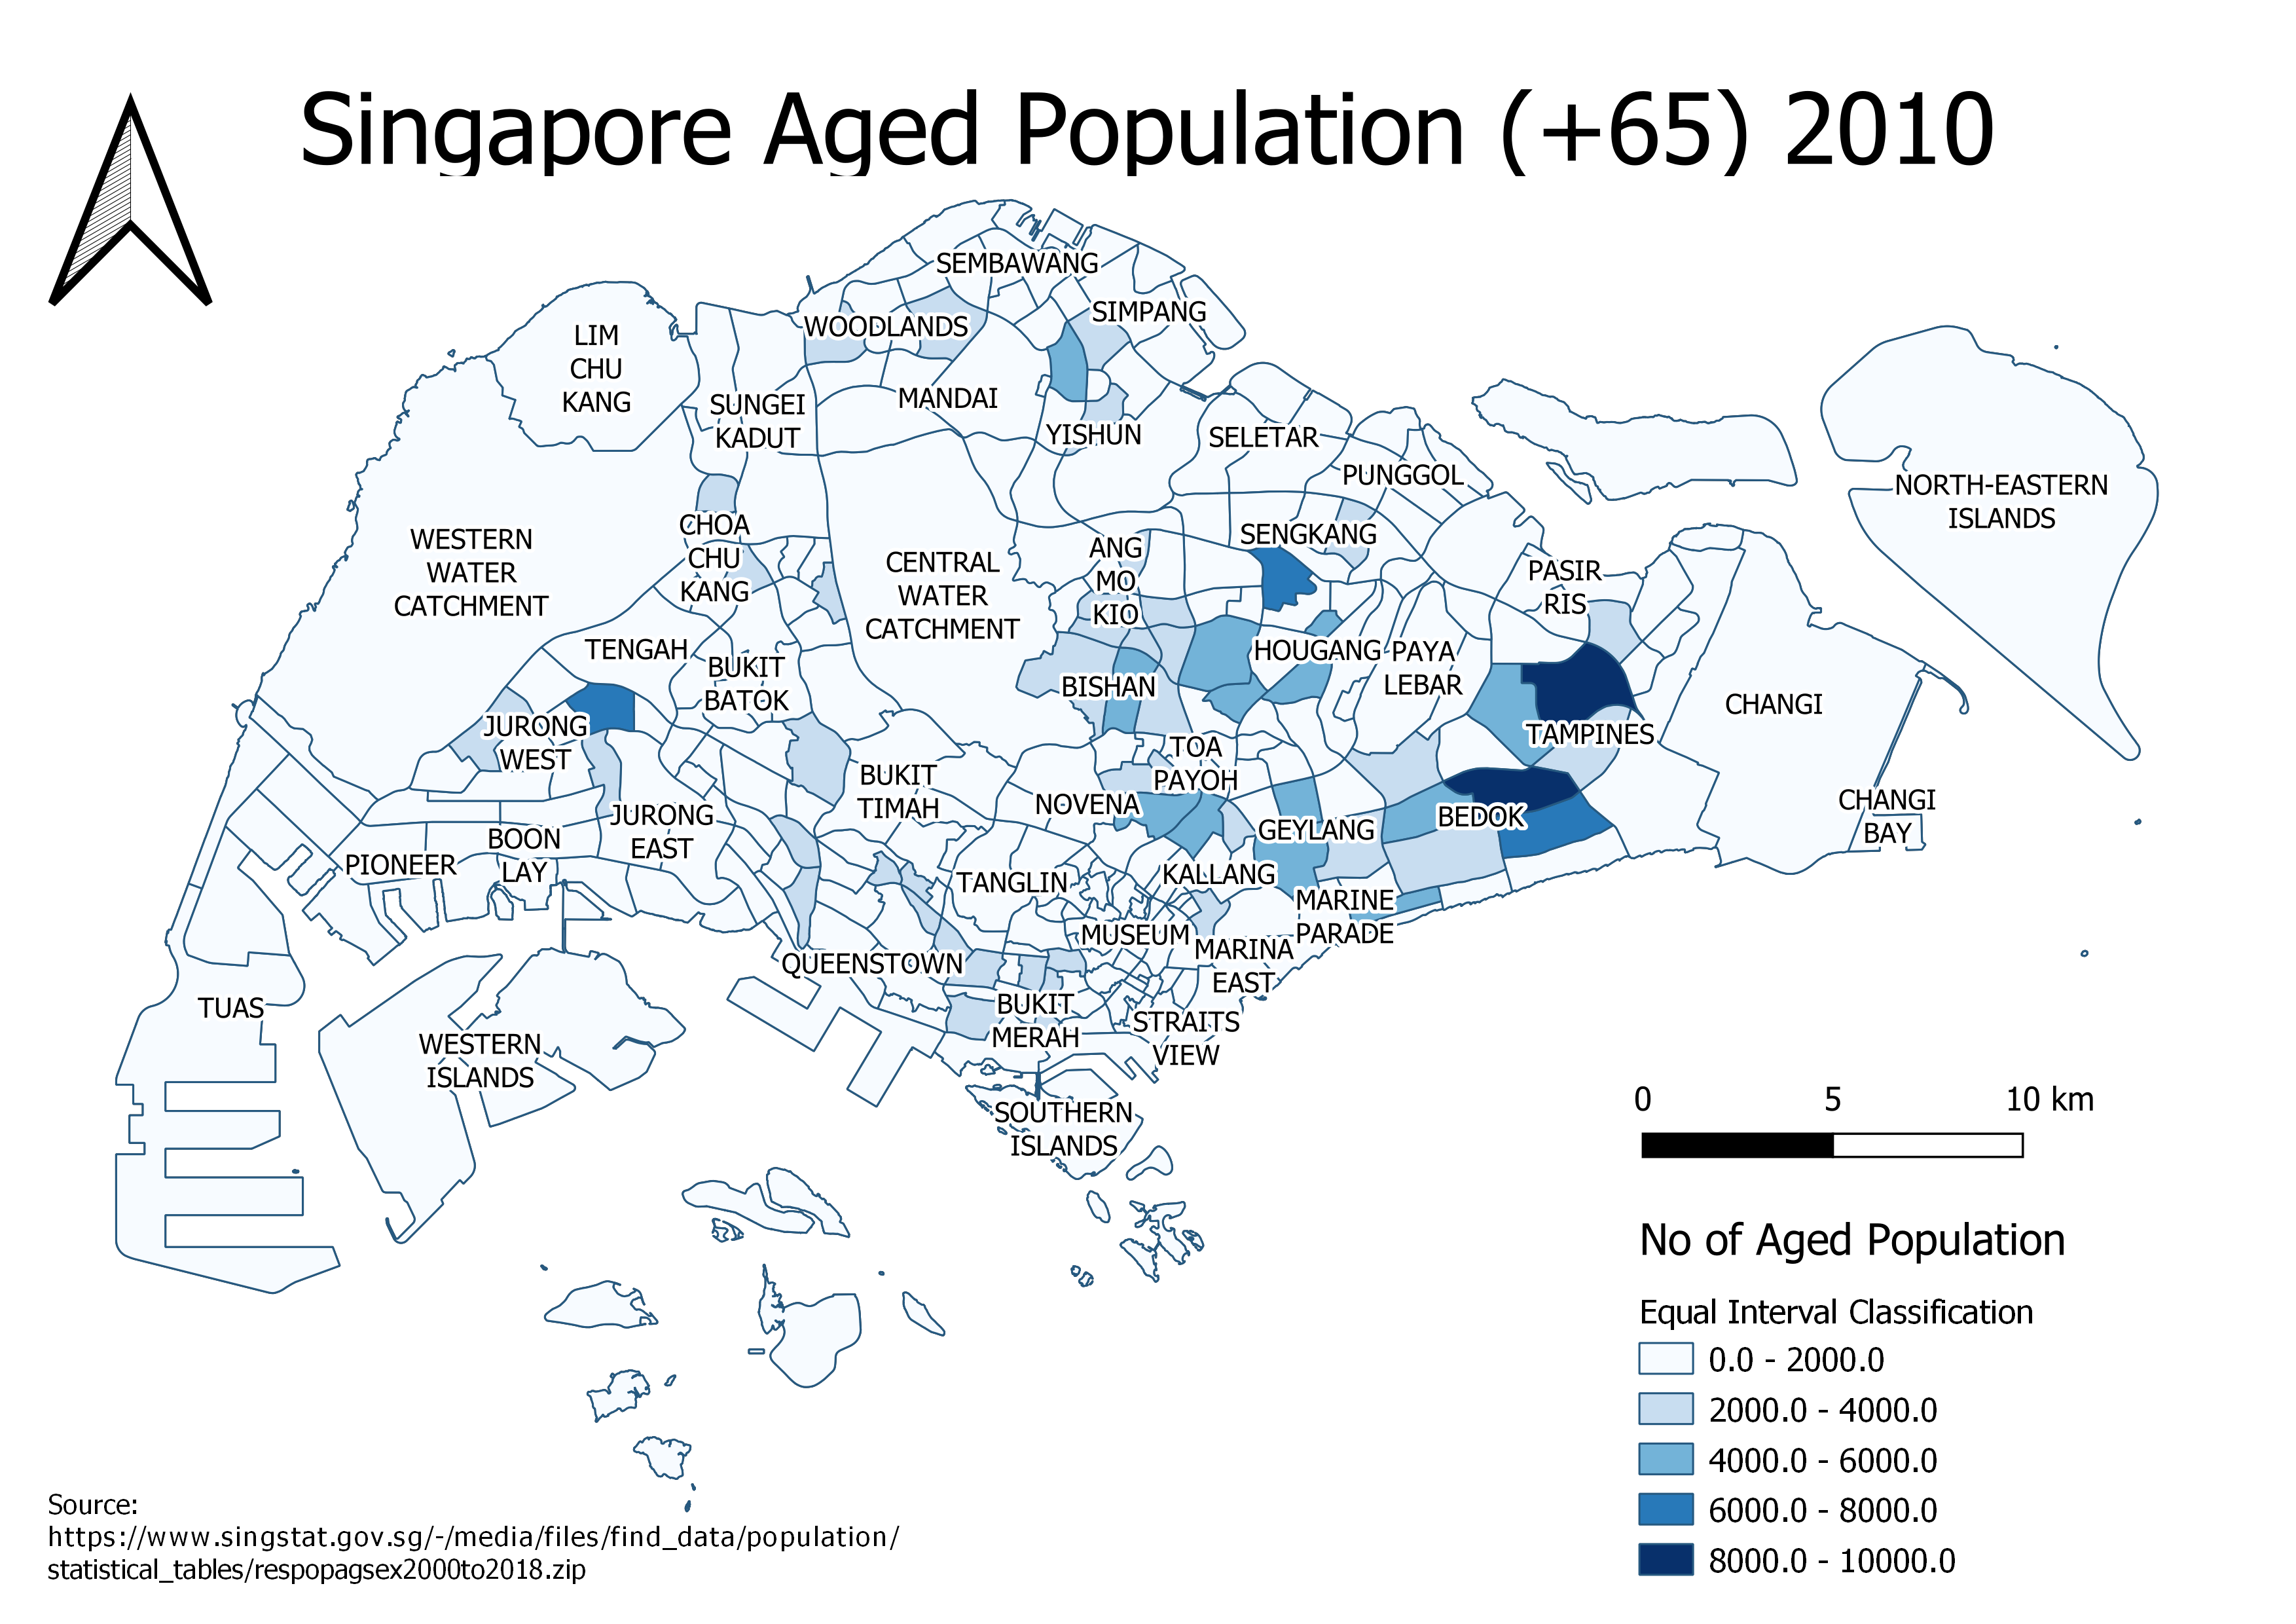
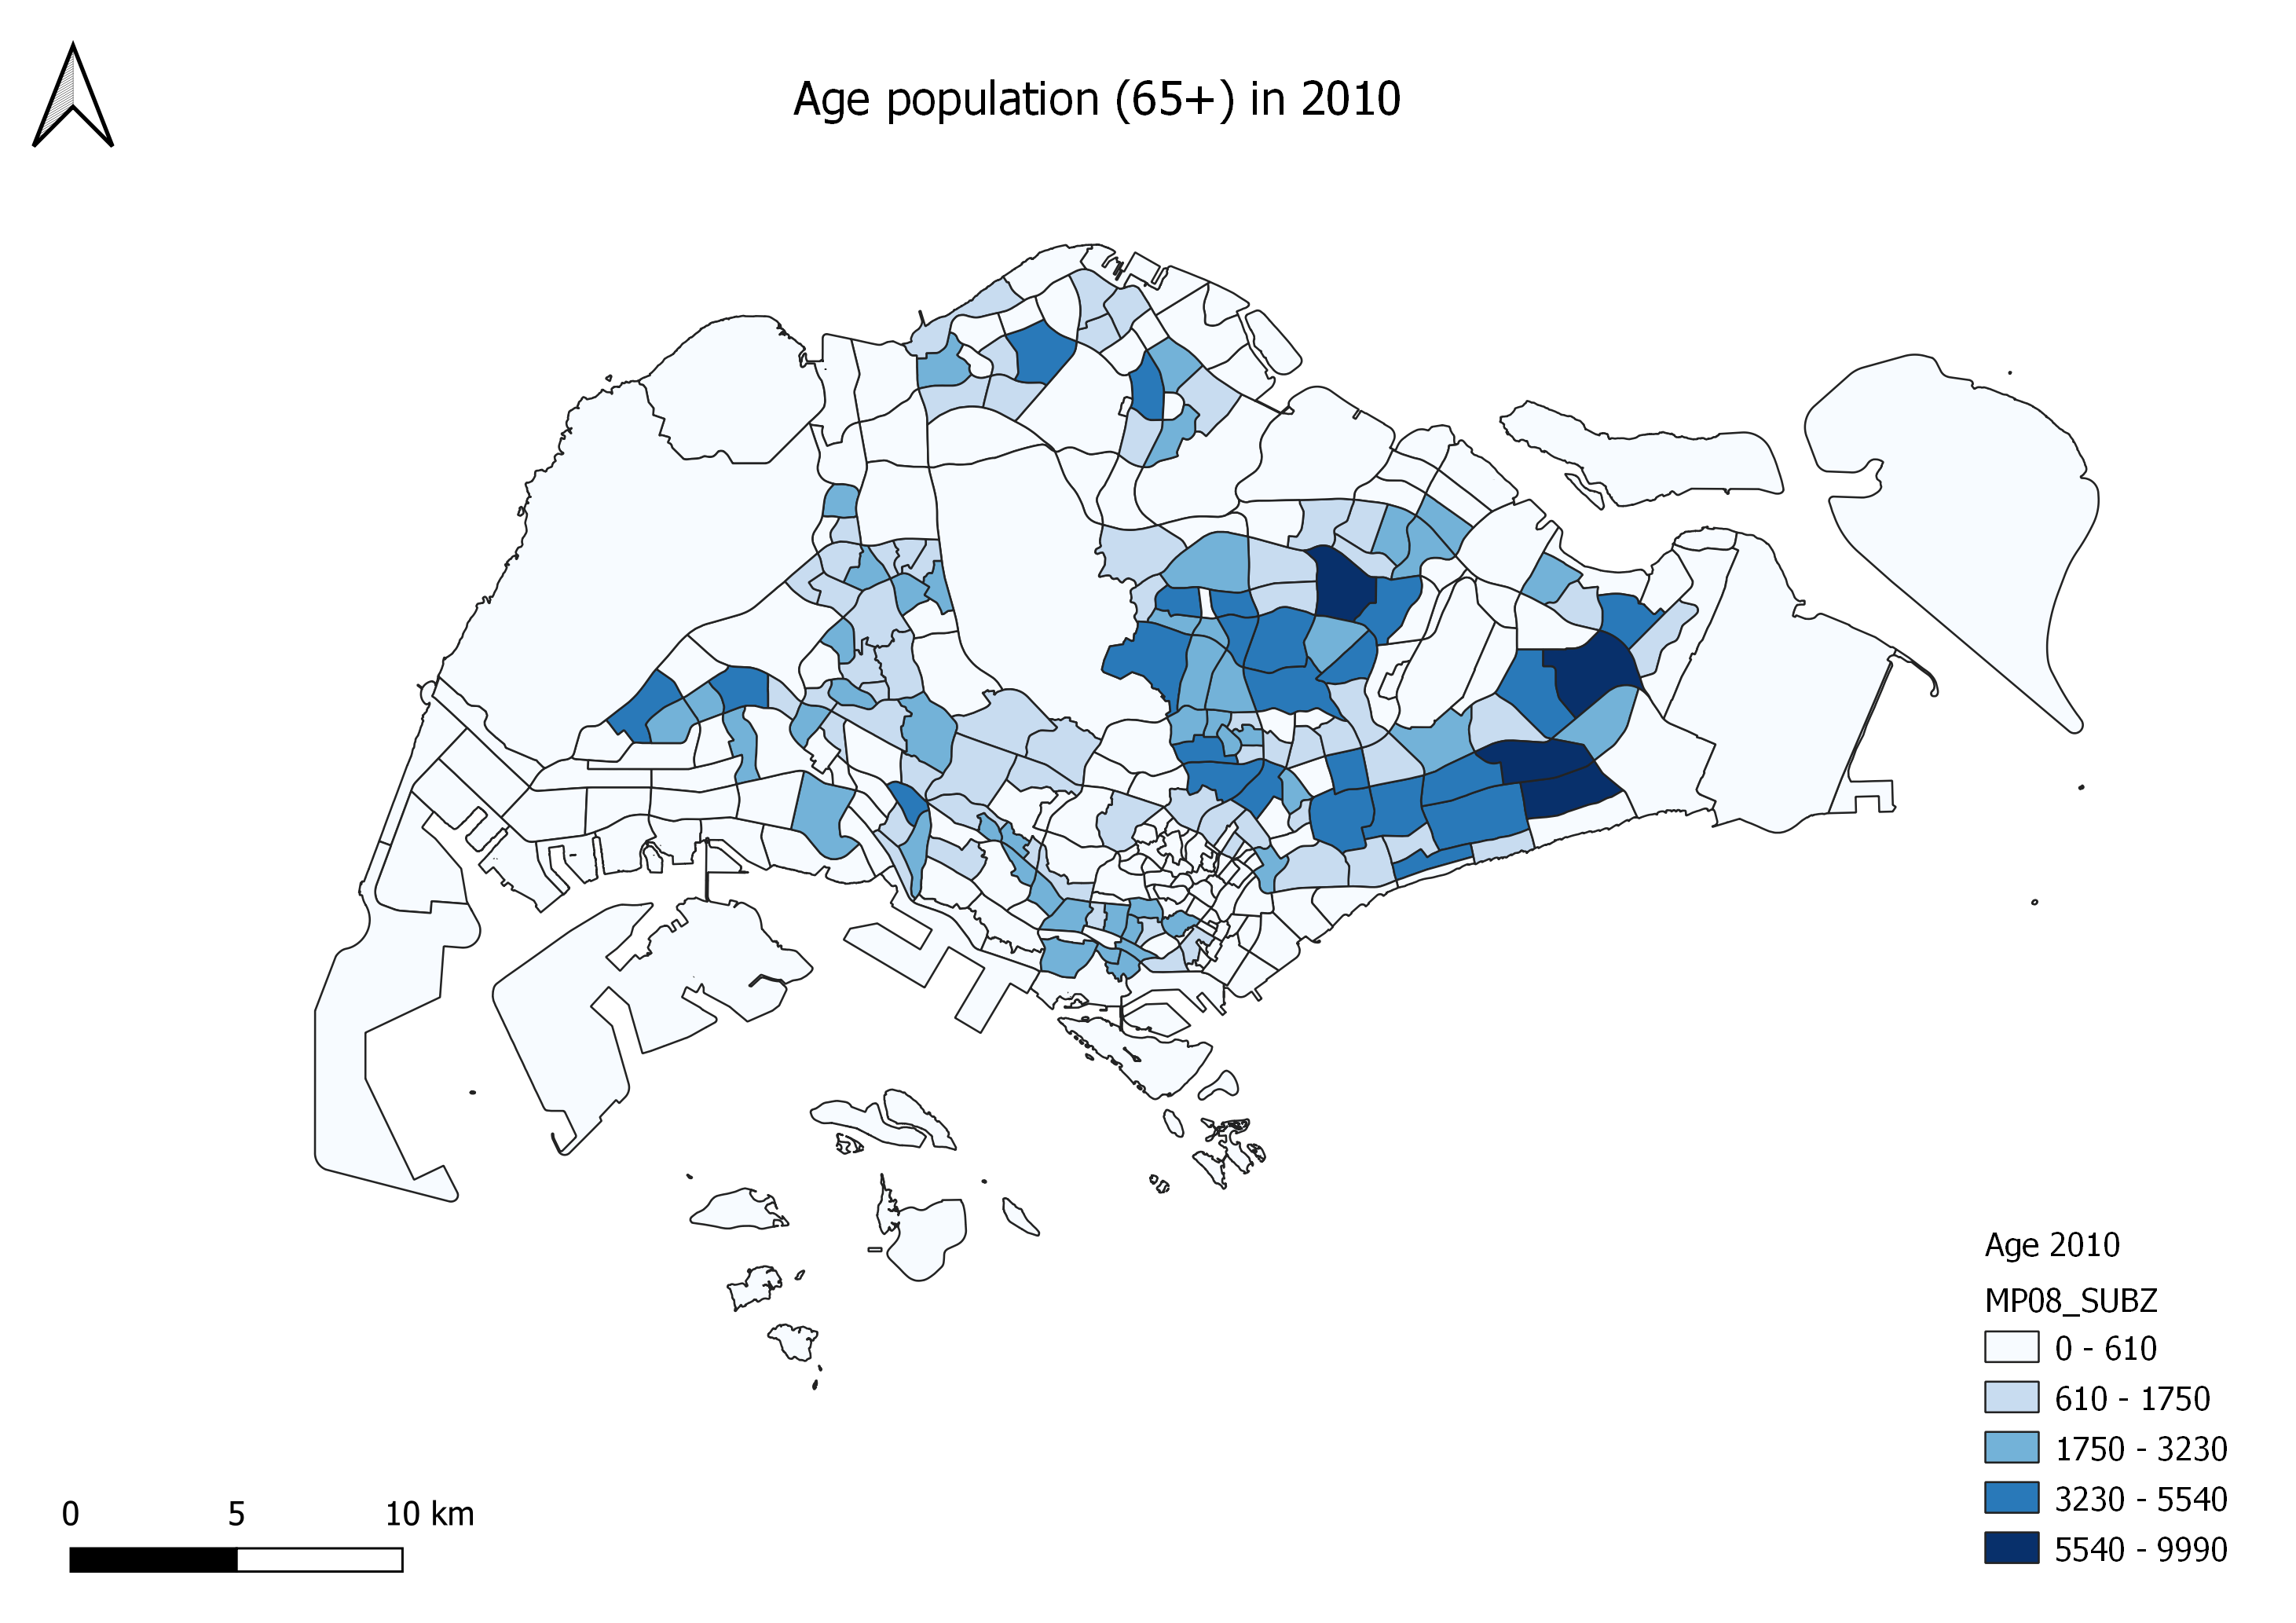
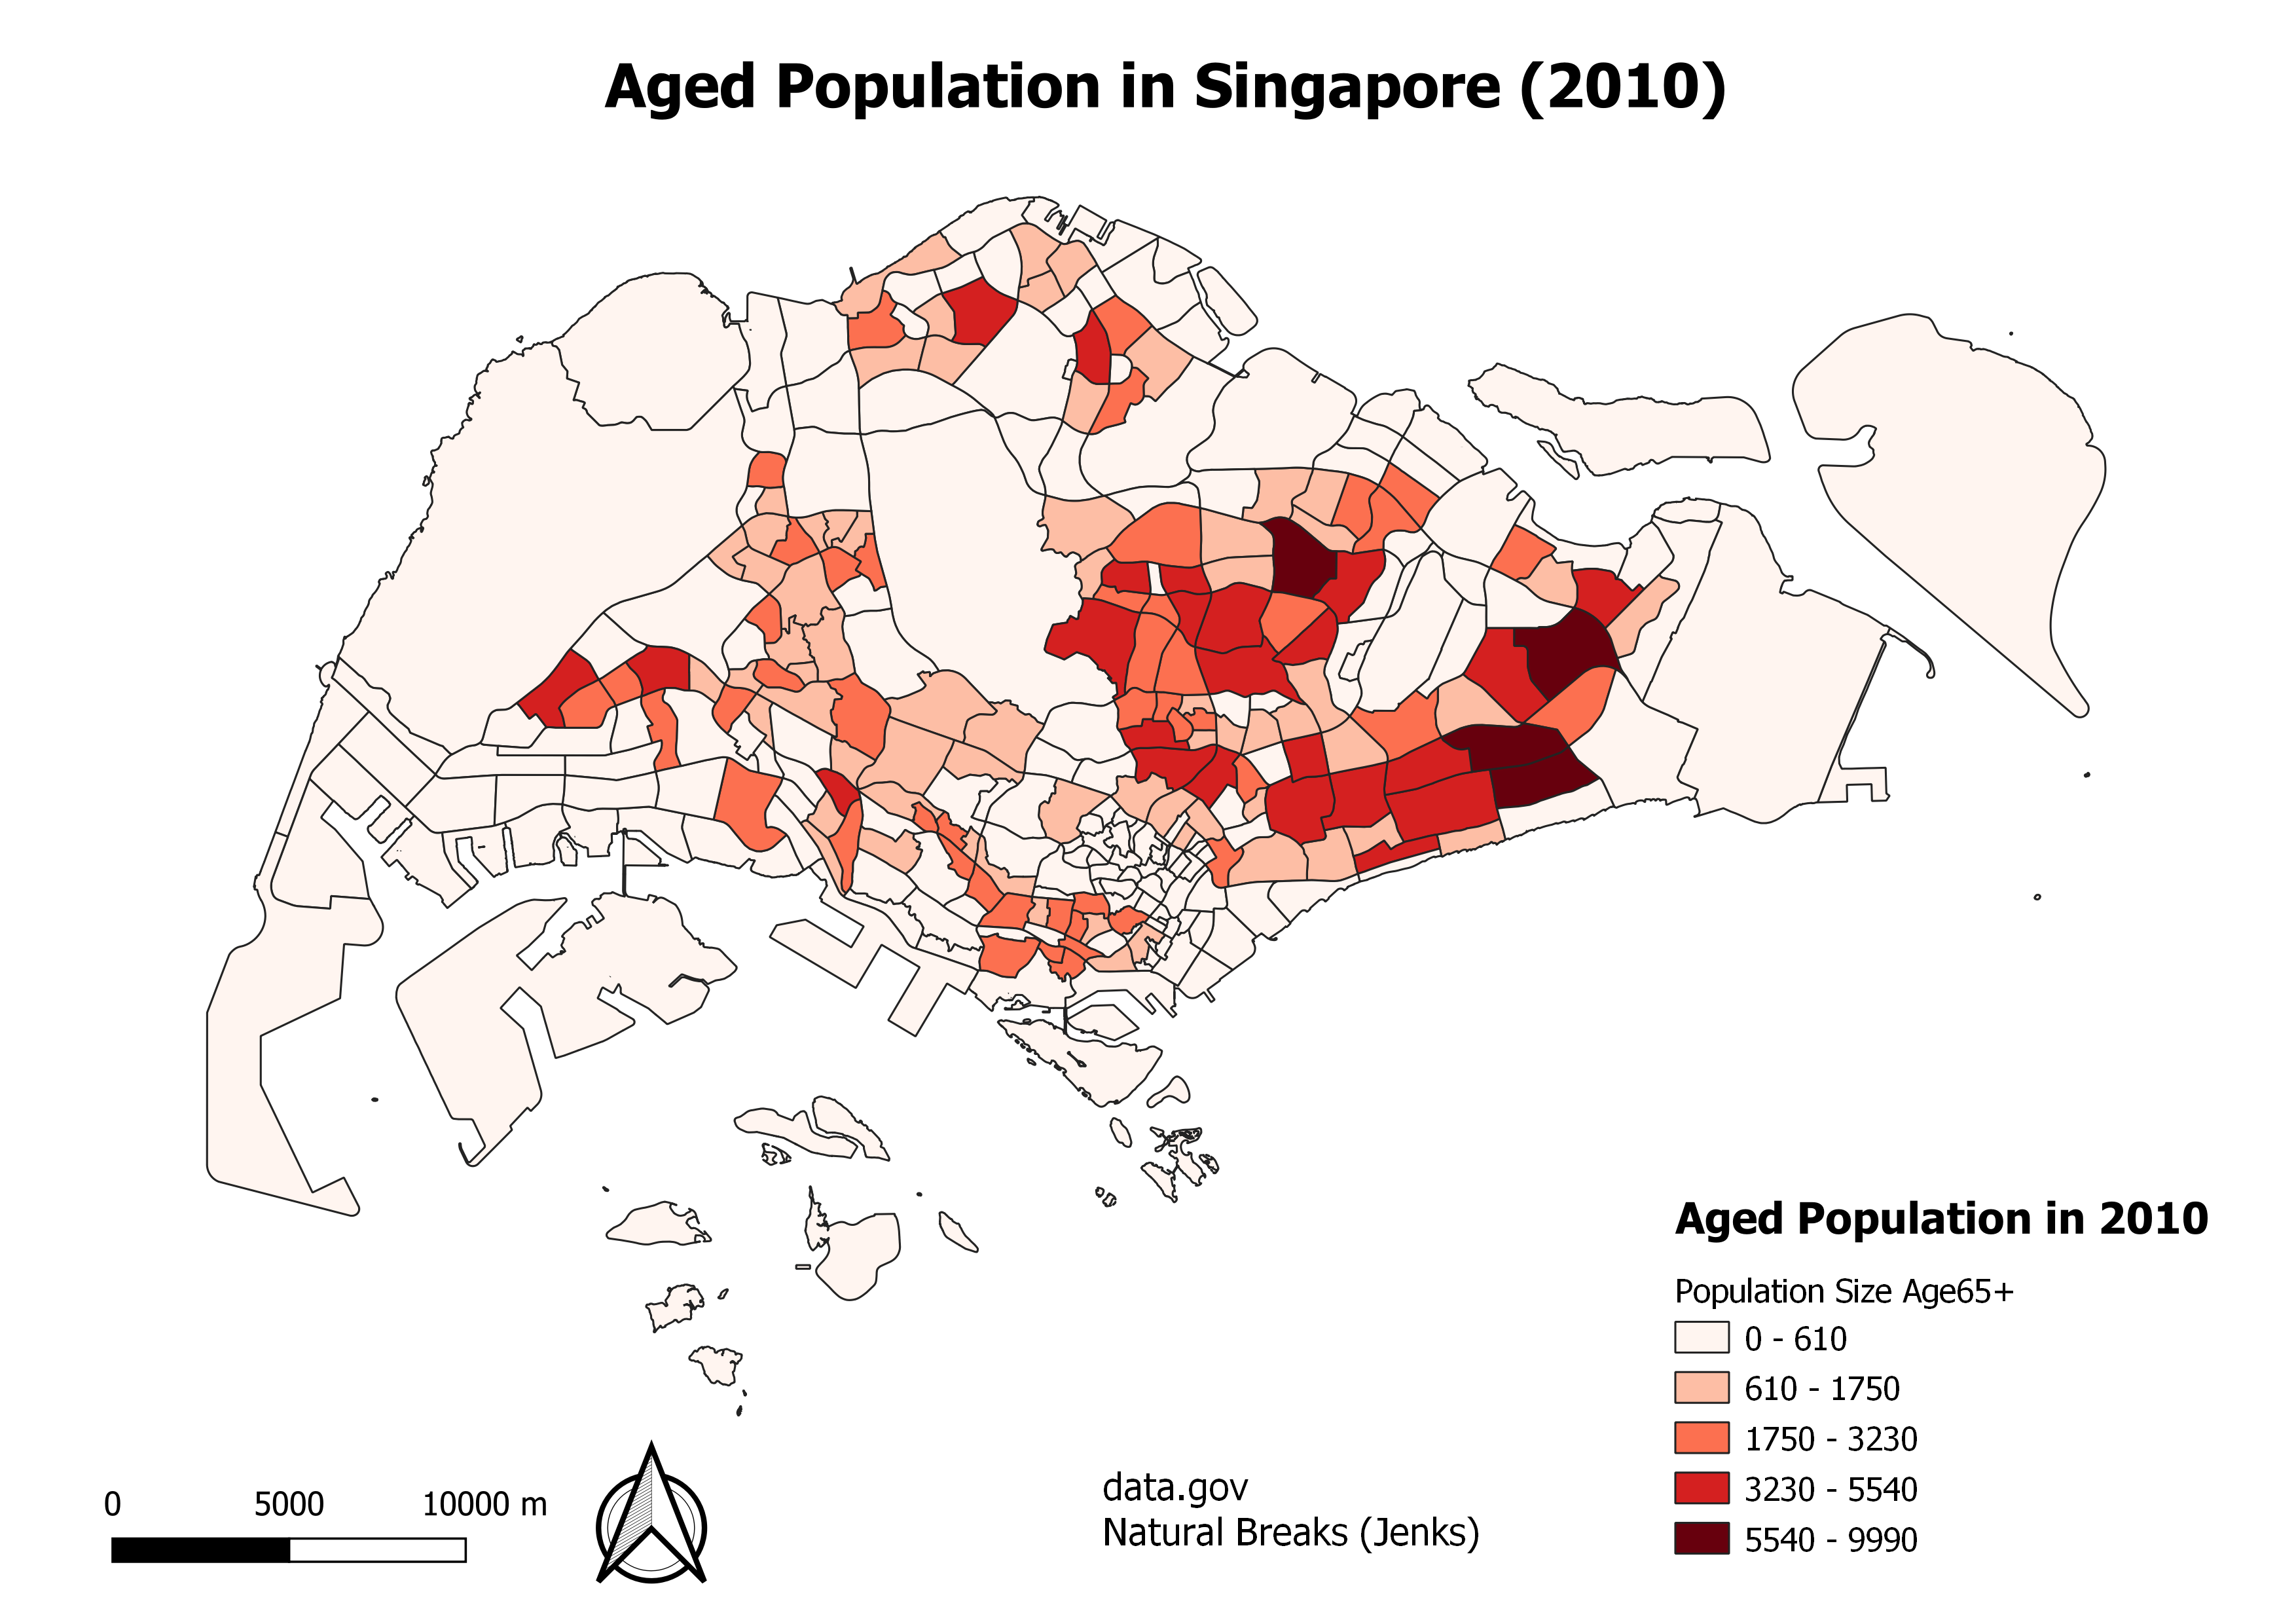
| 17:23, 15 September 2019 | Aged Population older than 65 2010.png (file) |  |
1.33 MB | Jimmeng.kok.2017 | 1 | |
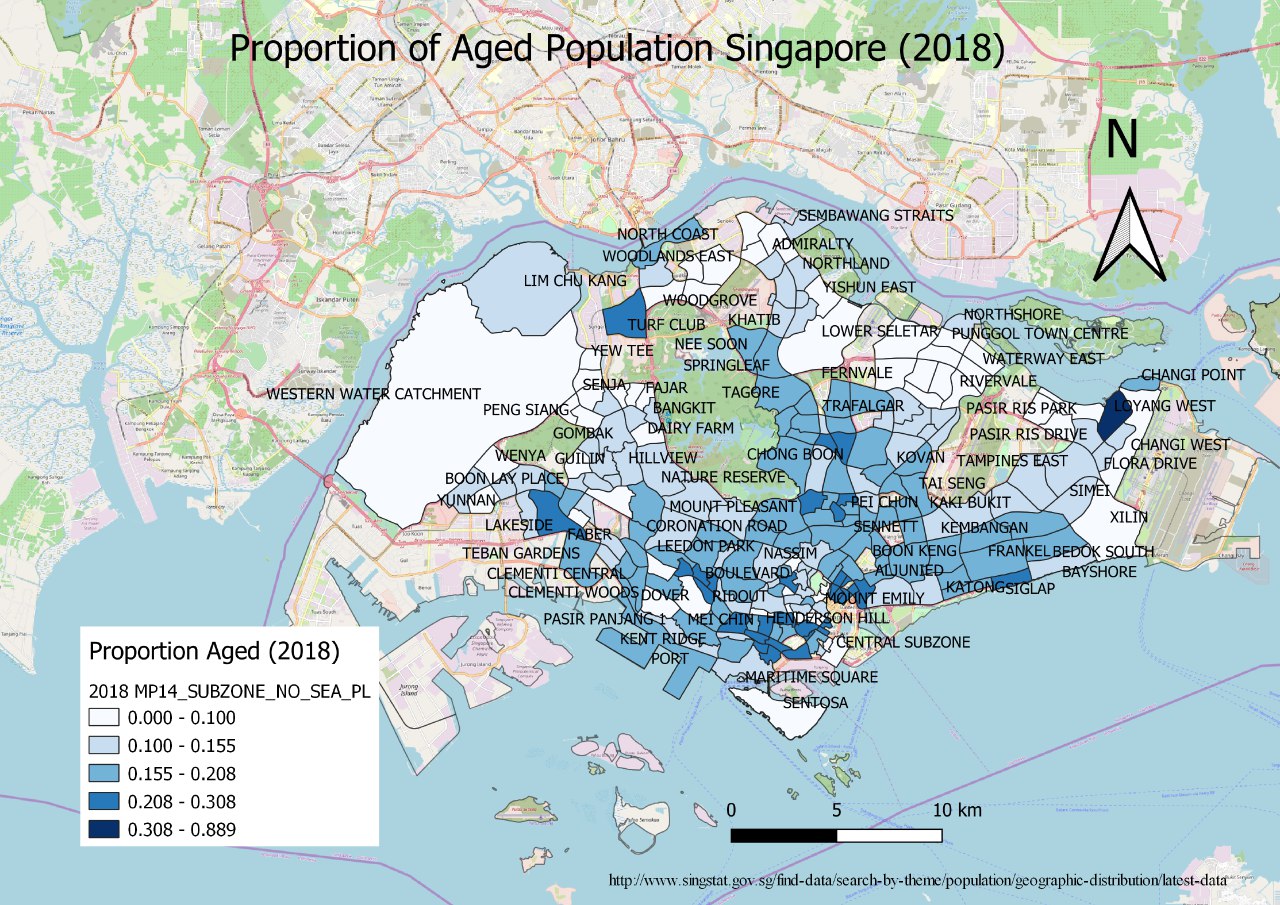
| 17:22, 15 September 2019 | TakeHomeEx1 Subzone2010Proportion.png (file) |  |
815 KB | Jayin.lee.2018 | 1 | |
| 17:21, 15 September 2019 | 2010 age.jpg (file) |  |
94 KB | Vanessa.au.2018 | 1 | |
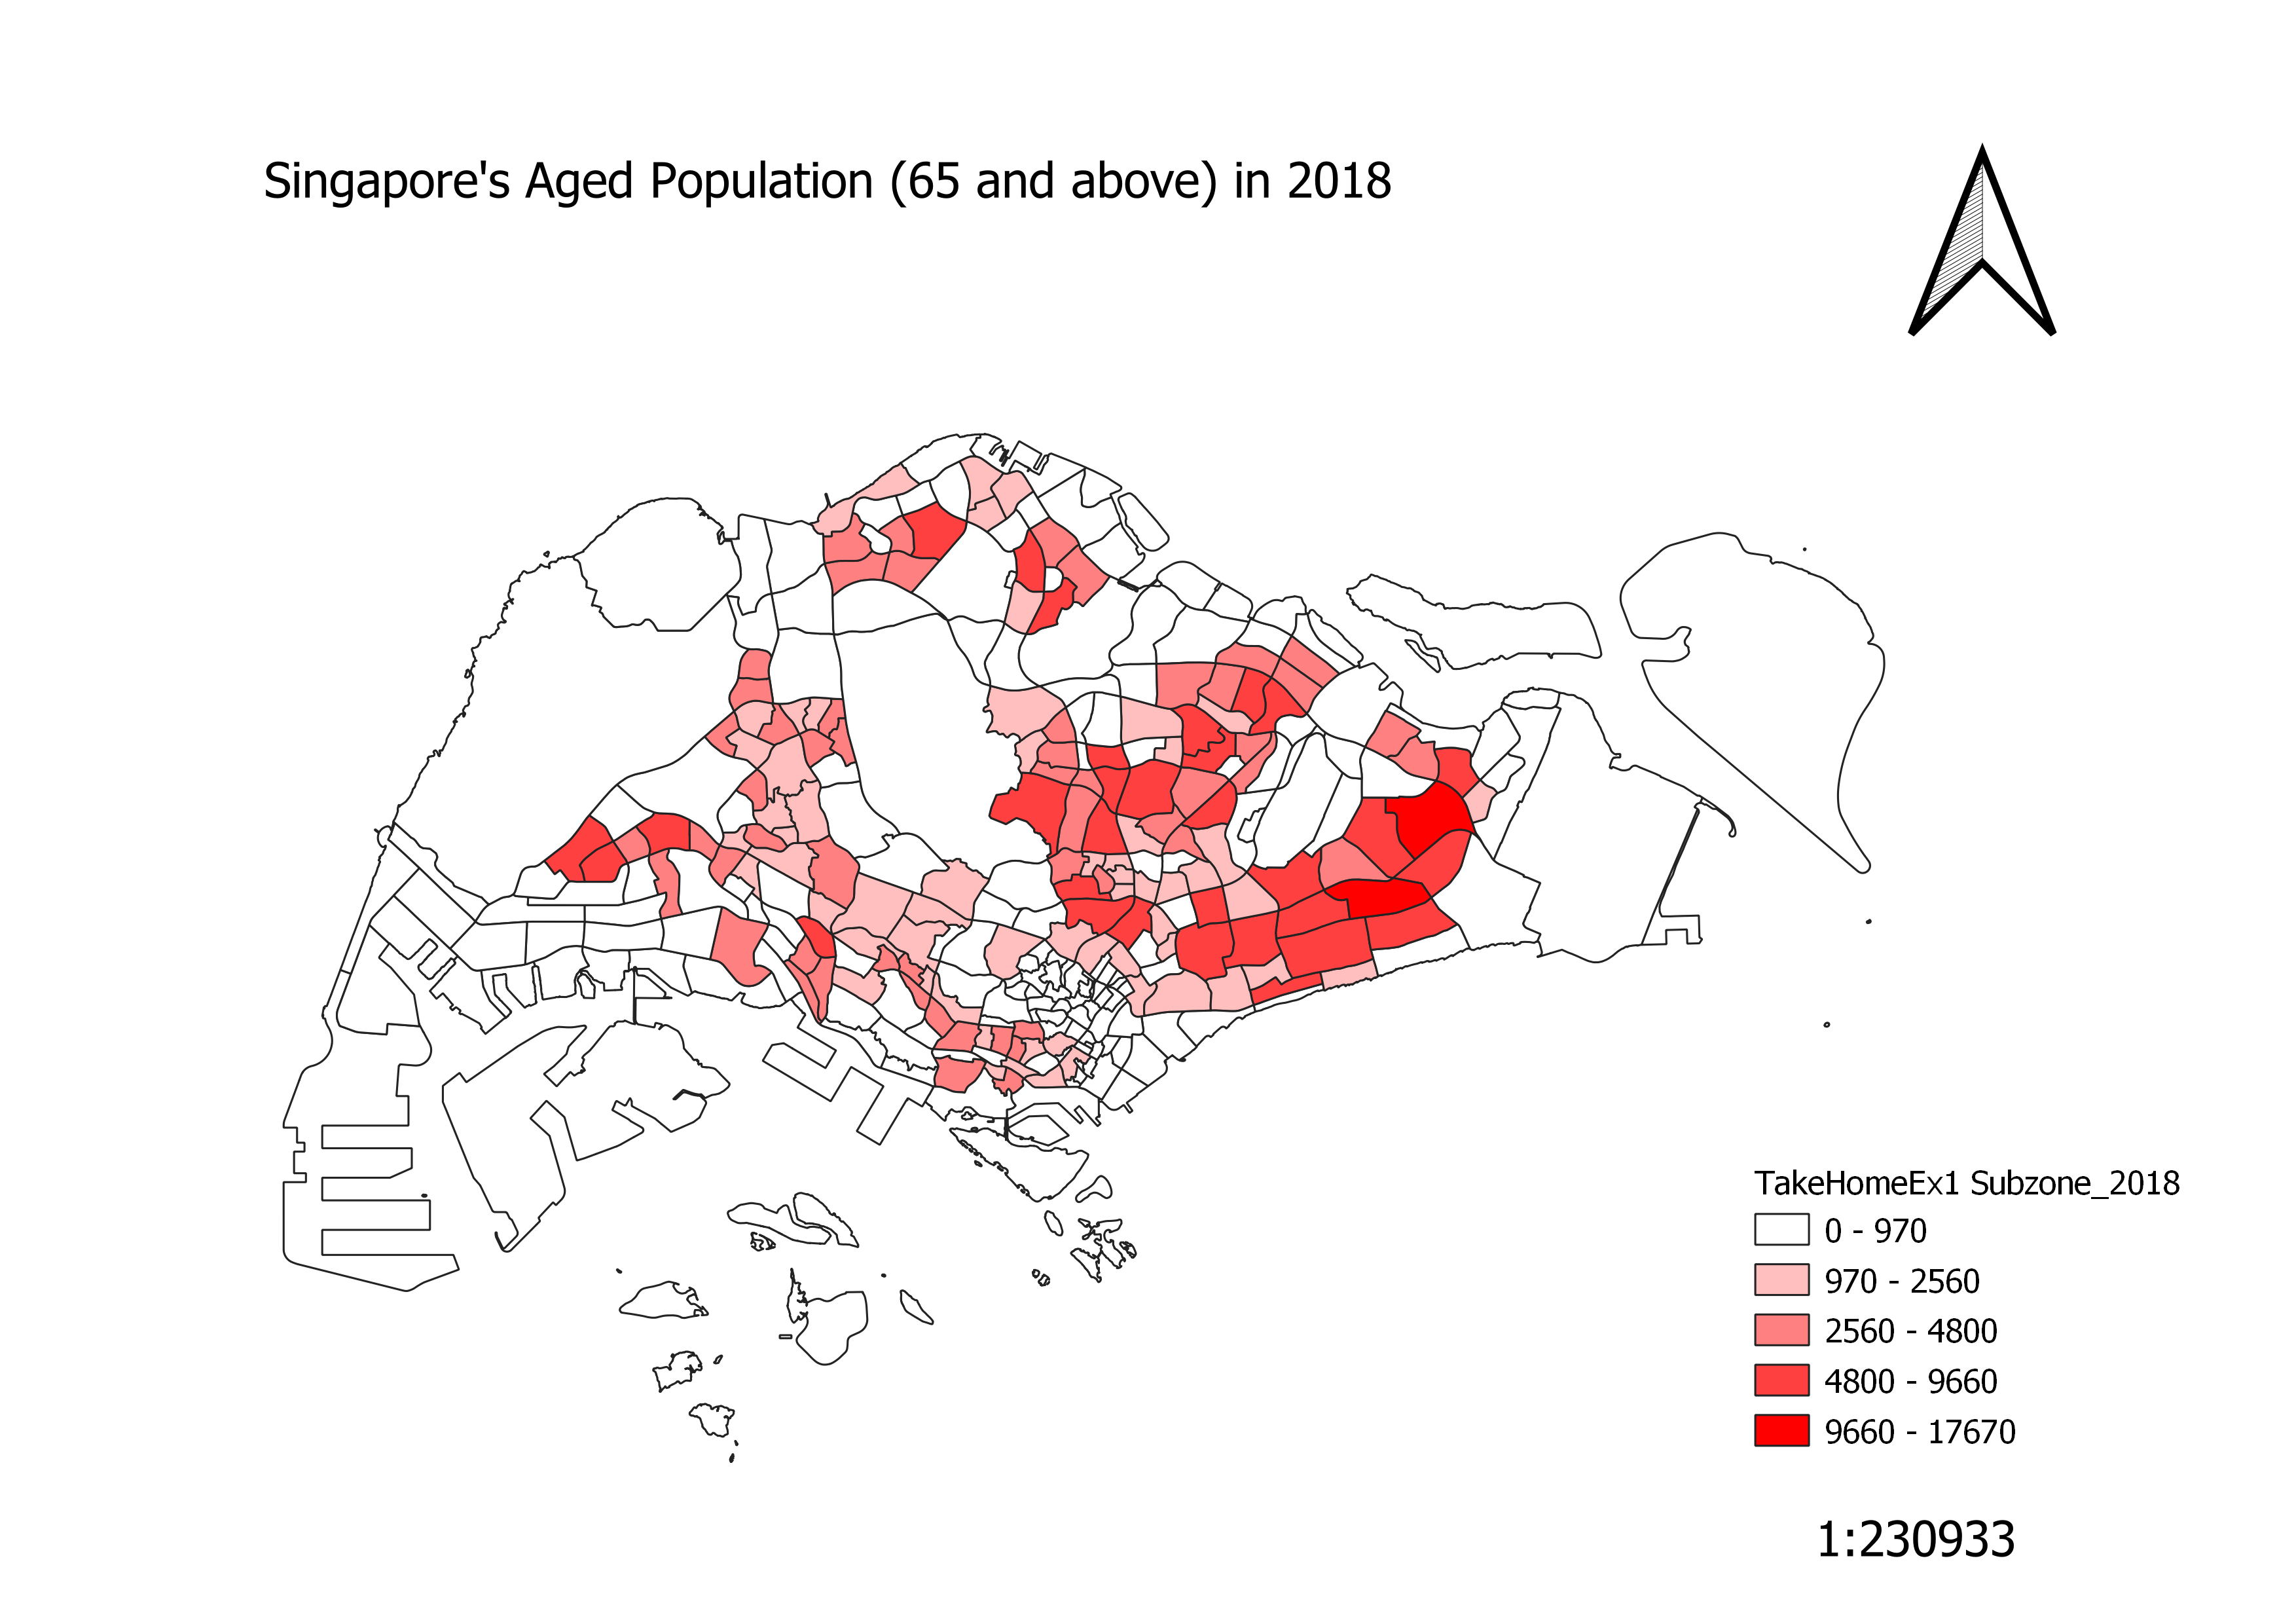
| 17:20, 15 September 2019 | TakeHomeEx1 Subzone2018.png (file) |  |
843 KB | Jayin.lee.2018 | 1 | |
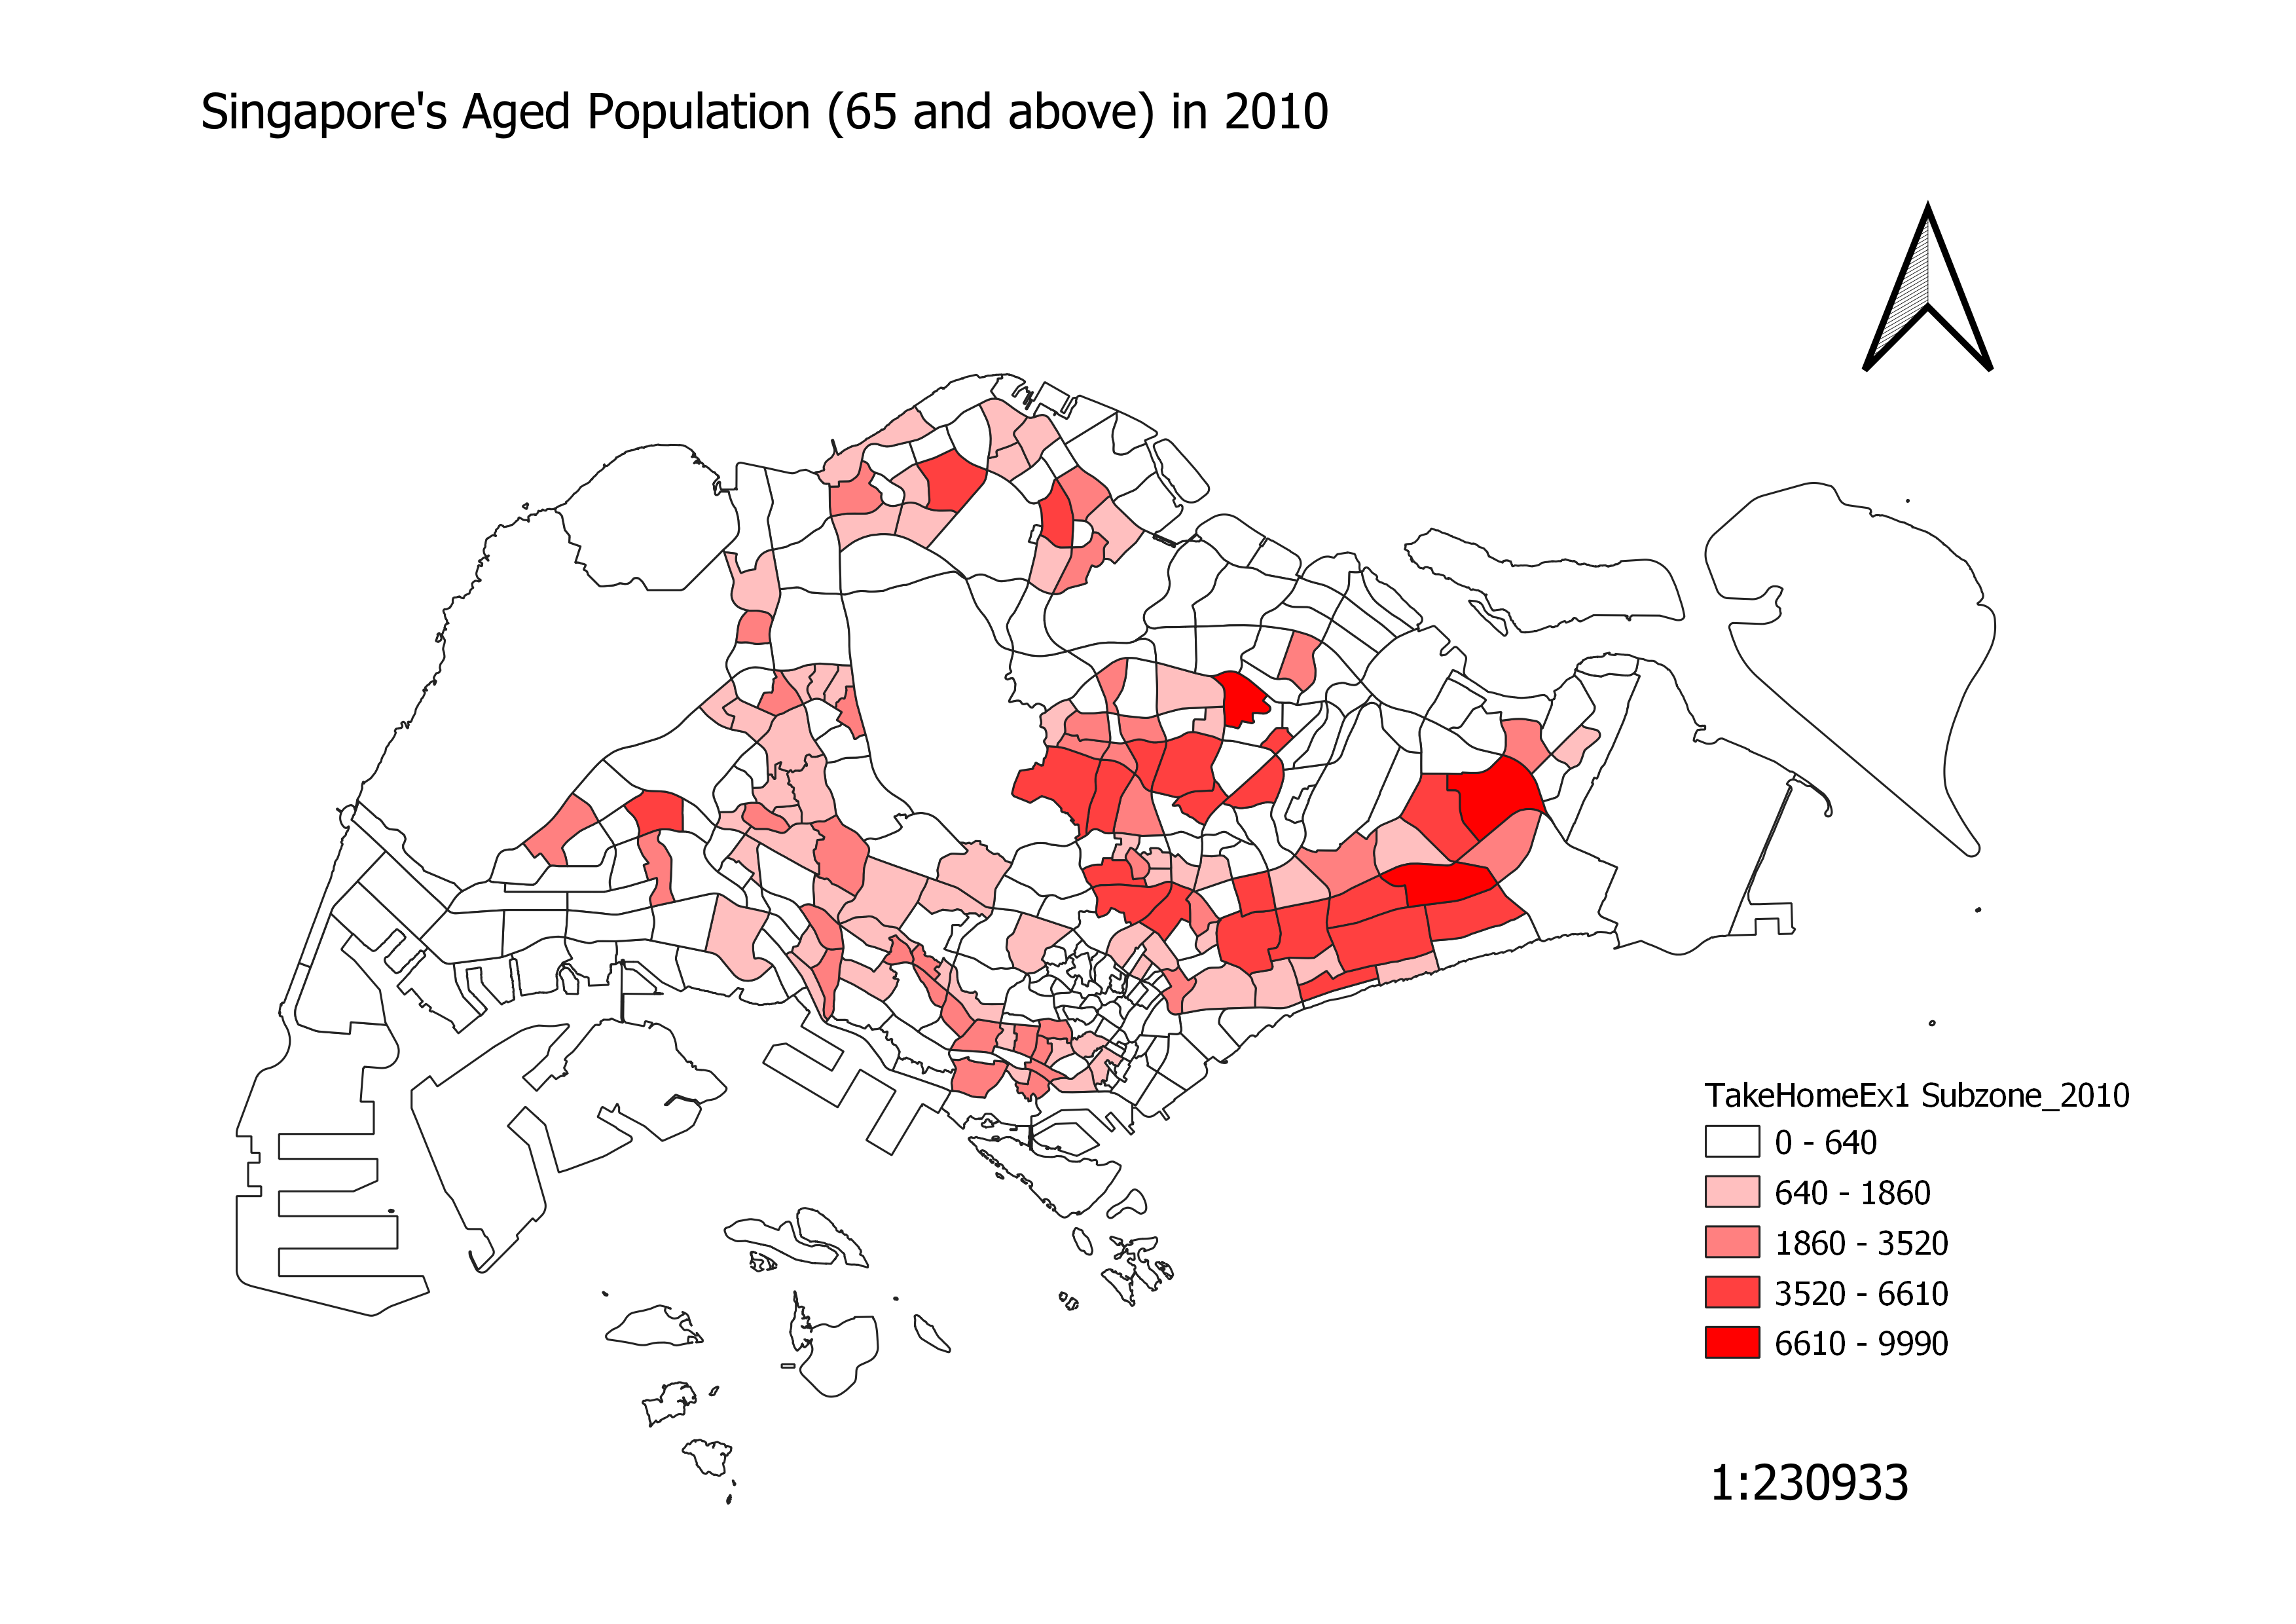
| 17:19, 15 September 2019 | TakeHomeEx1 Subzone2010.png (file) |  |
910 KB | Jayin.lee.2018 | 1 | |
| 17:18, 15 September 2019 | Singapore Land Use MP14.png (file) |  |
524 KB | Jimmeng.kok.2017 | 1 | |
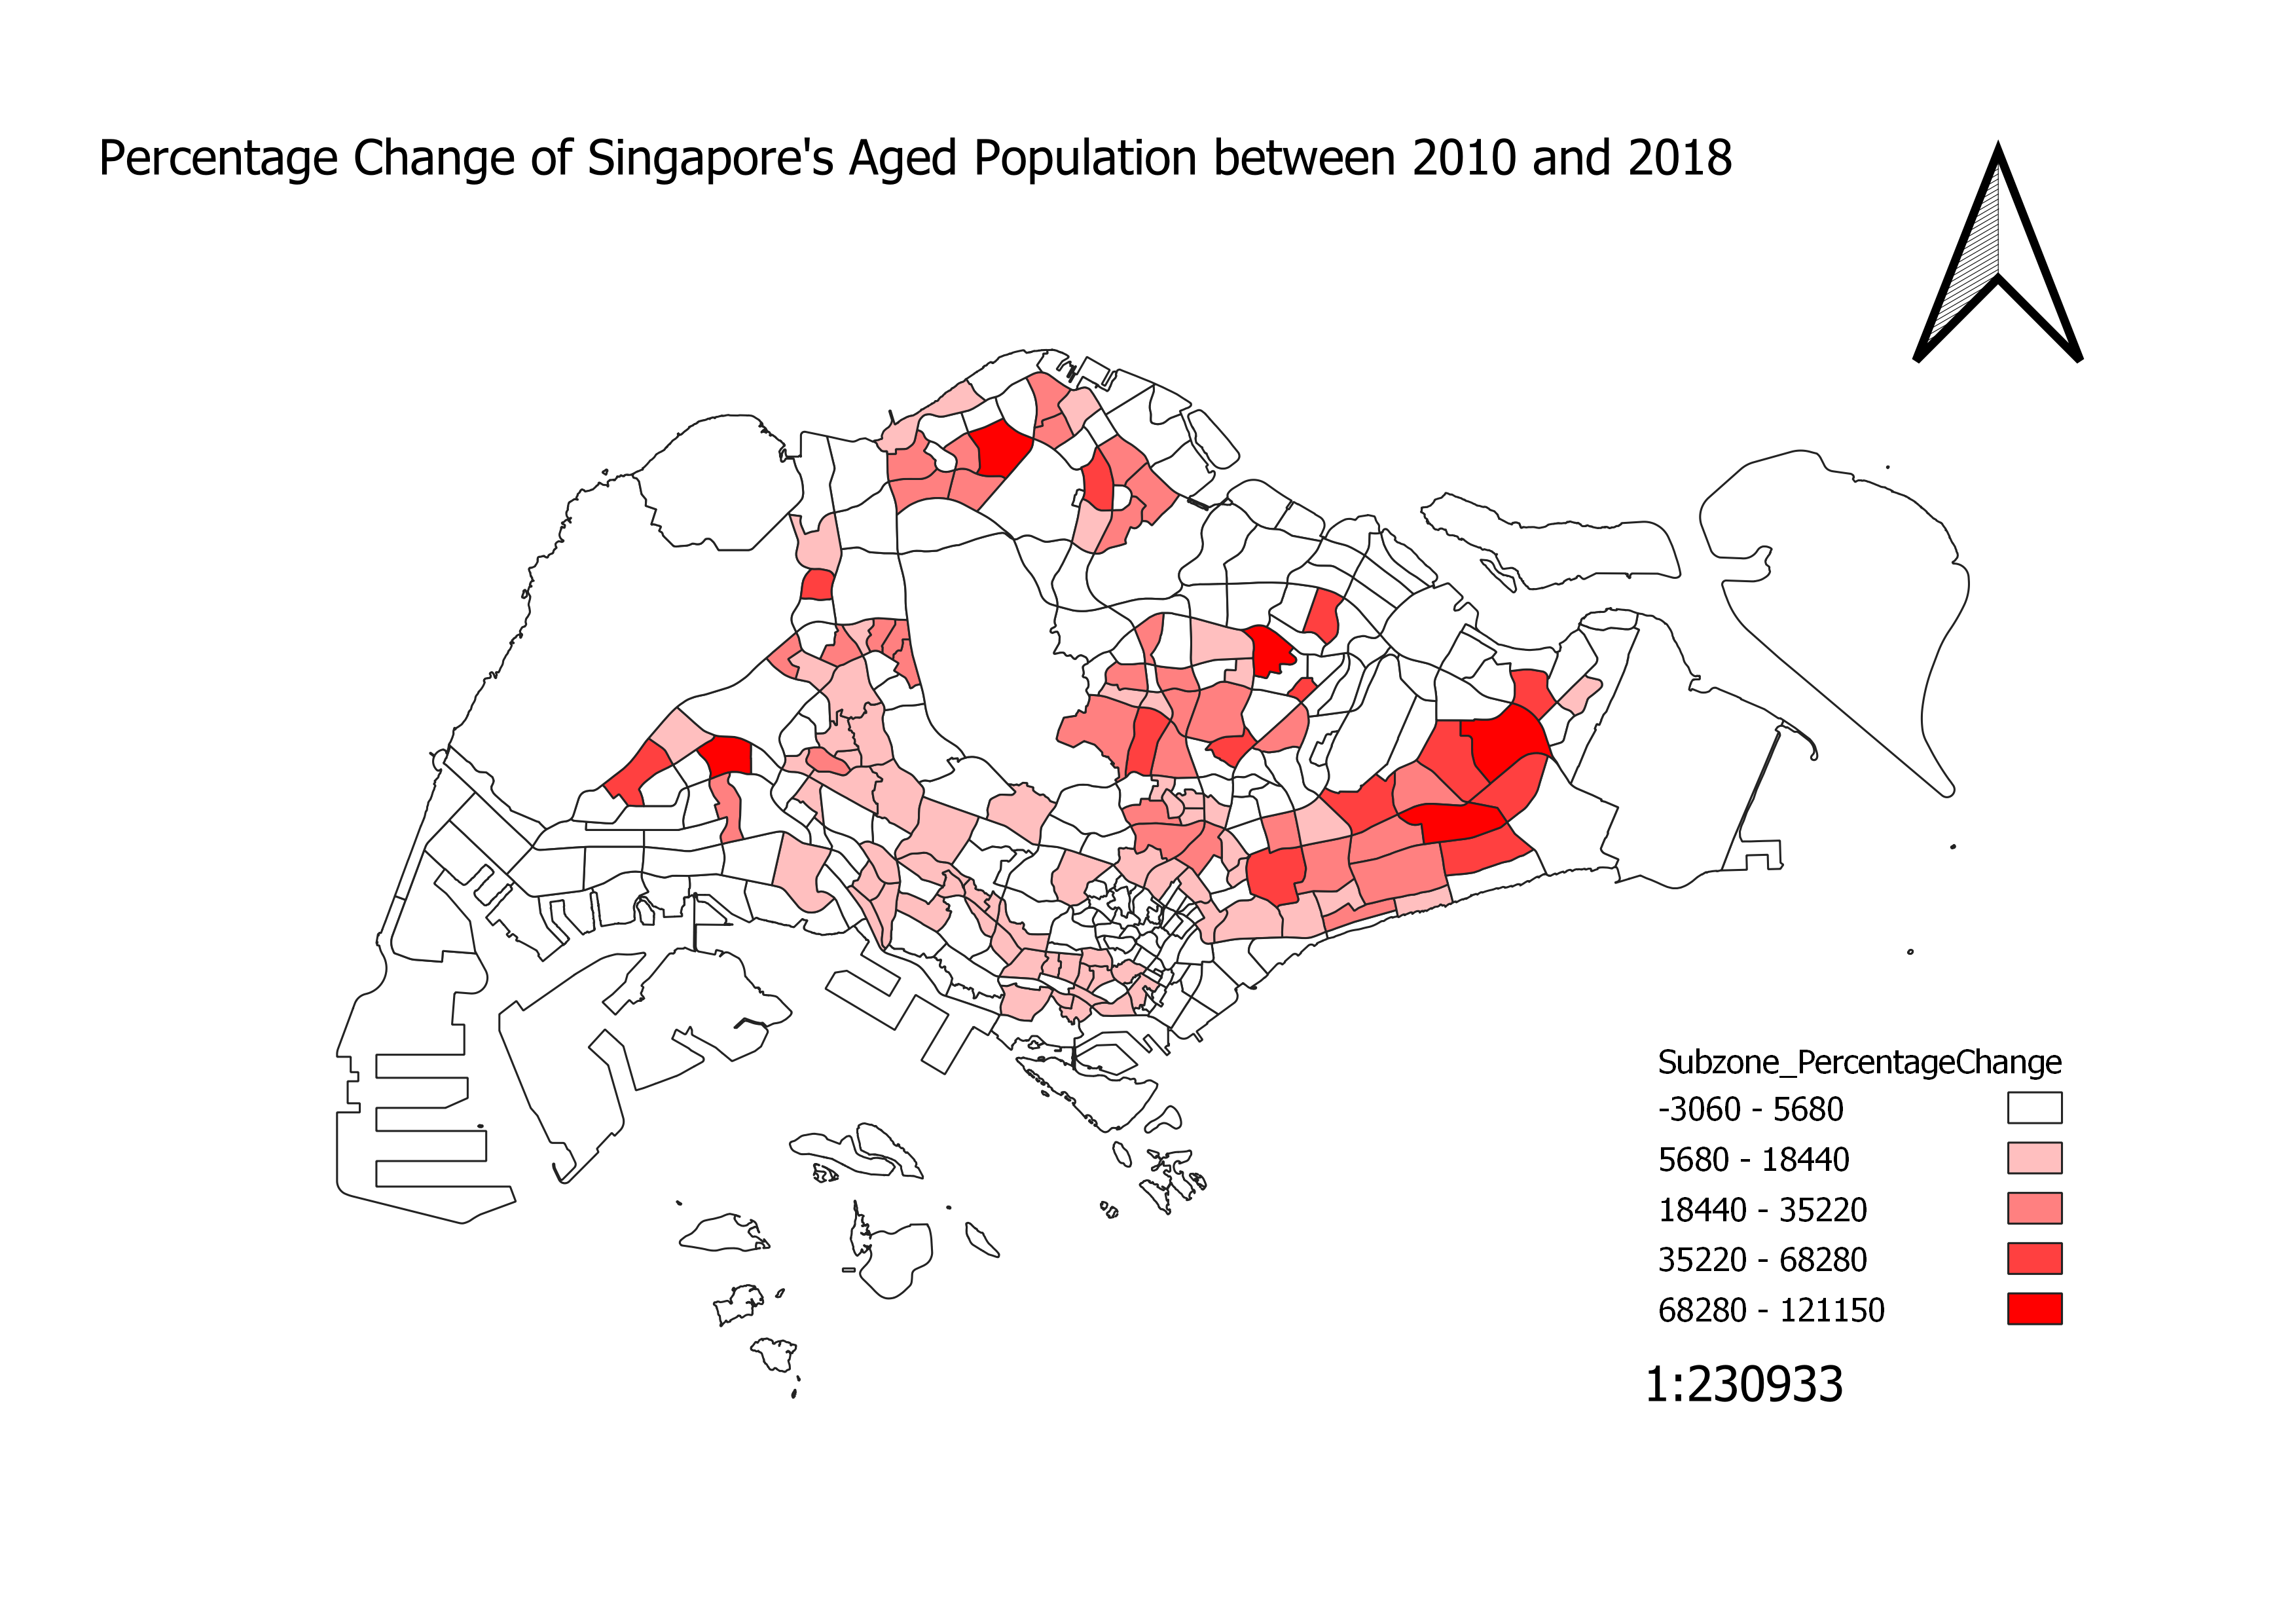
| 17:18, 15 September 2019 | TakeHomeEx1 PercentageChange.png (file) |  |
878 KB | Jayin.lee.2018 | 1 | |
| 17:17, 15 September 2019 | Percentage chng.png (file) |  |
895 KB | Vanessa.au.2018 | 1 | |
| 17:13, 15 September 2019 | Road Network Singapore.png (file) |  |
1.94 MB | Jimmeng.kok.2017 | 1 | |
| 17:09, 15 September 2019 | Wyj Schoo layer.PNG (file) |  |
13 KB | Youjin.wang.2016 | 1 | |
| 17:06, 15 September 2019 | Education.png (file) |  |
1.73 MB | Vanessa.au.2018 | 2 | |
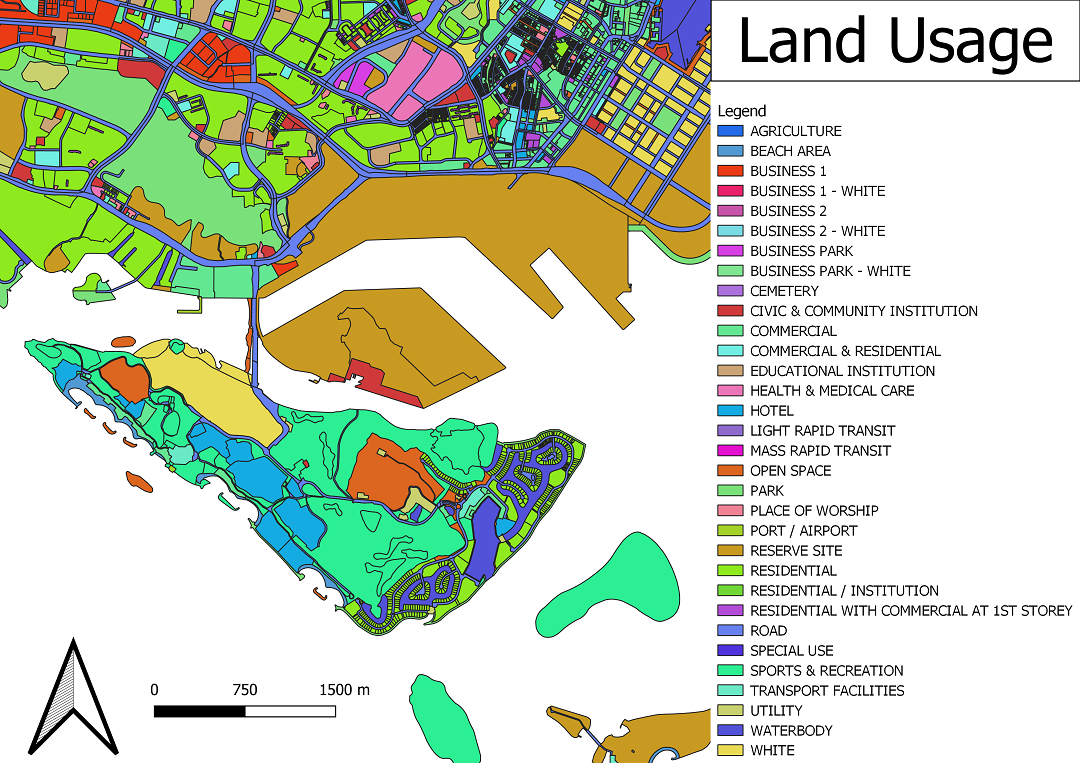
| 17:05, 15 September 2019 | Map3 land usage.png (file) |  |
562 KB | Shenjie.lim.2018 | Shows the land usage in Singapore | 1 |
| 17:05, 15 September 2019 | Aged Population in 2010 JeromeQuah.png (file) |  |
327 KB | Jerome.quah.2018 | 1 | |
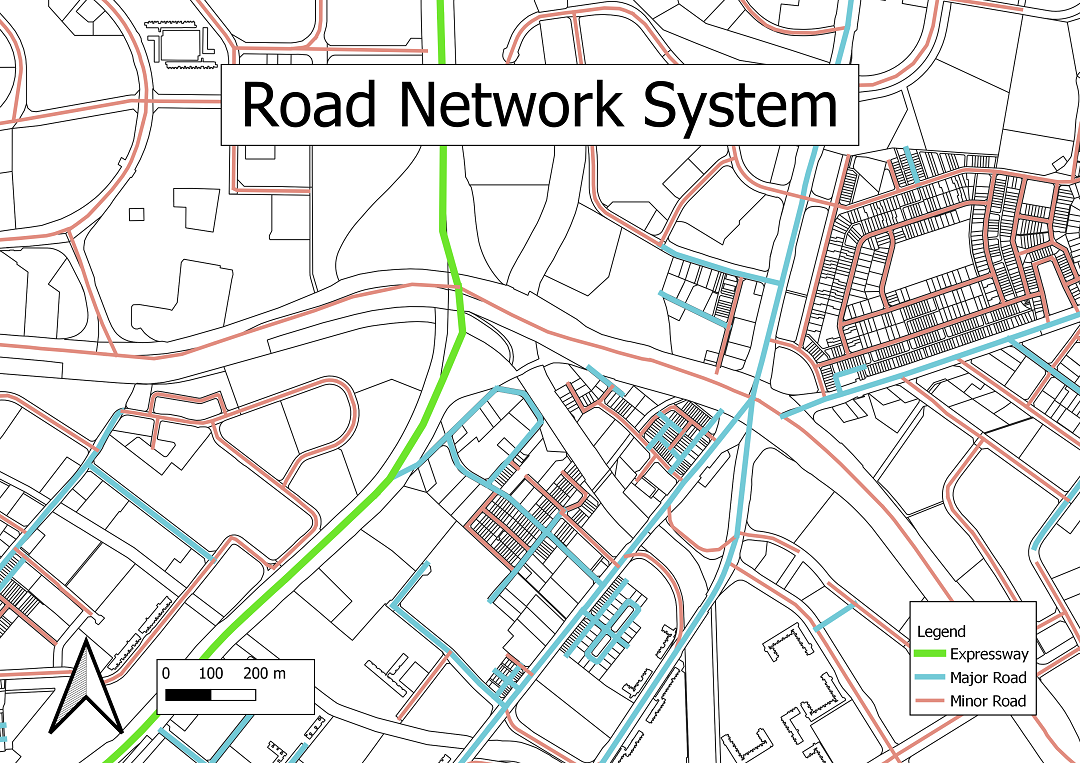
| 17:05, 15 September 2019 | Map2 roads.png (file) |  |
516 KB | Shenjie.lim.2018 | Shows the roads in Singapore | 1 |
| 17:05, 15 September 2019 | Percentage change 2010-2018.png (file) |  |
196 KB | Yu.zang.2016 | 1 | |
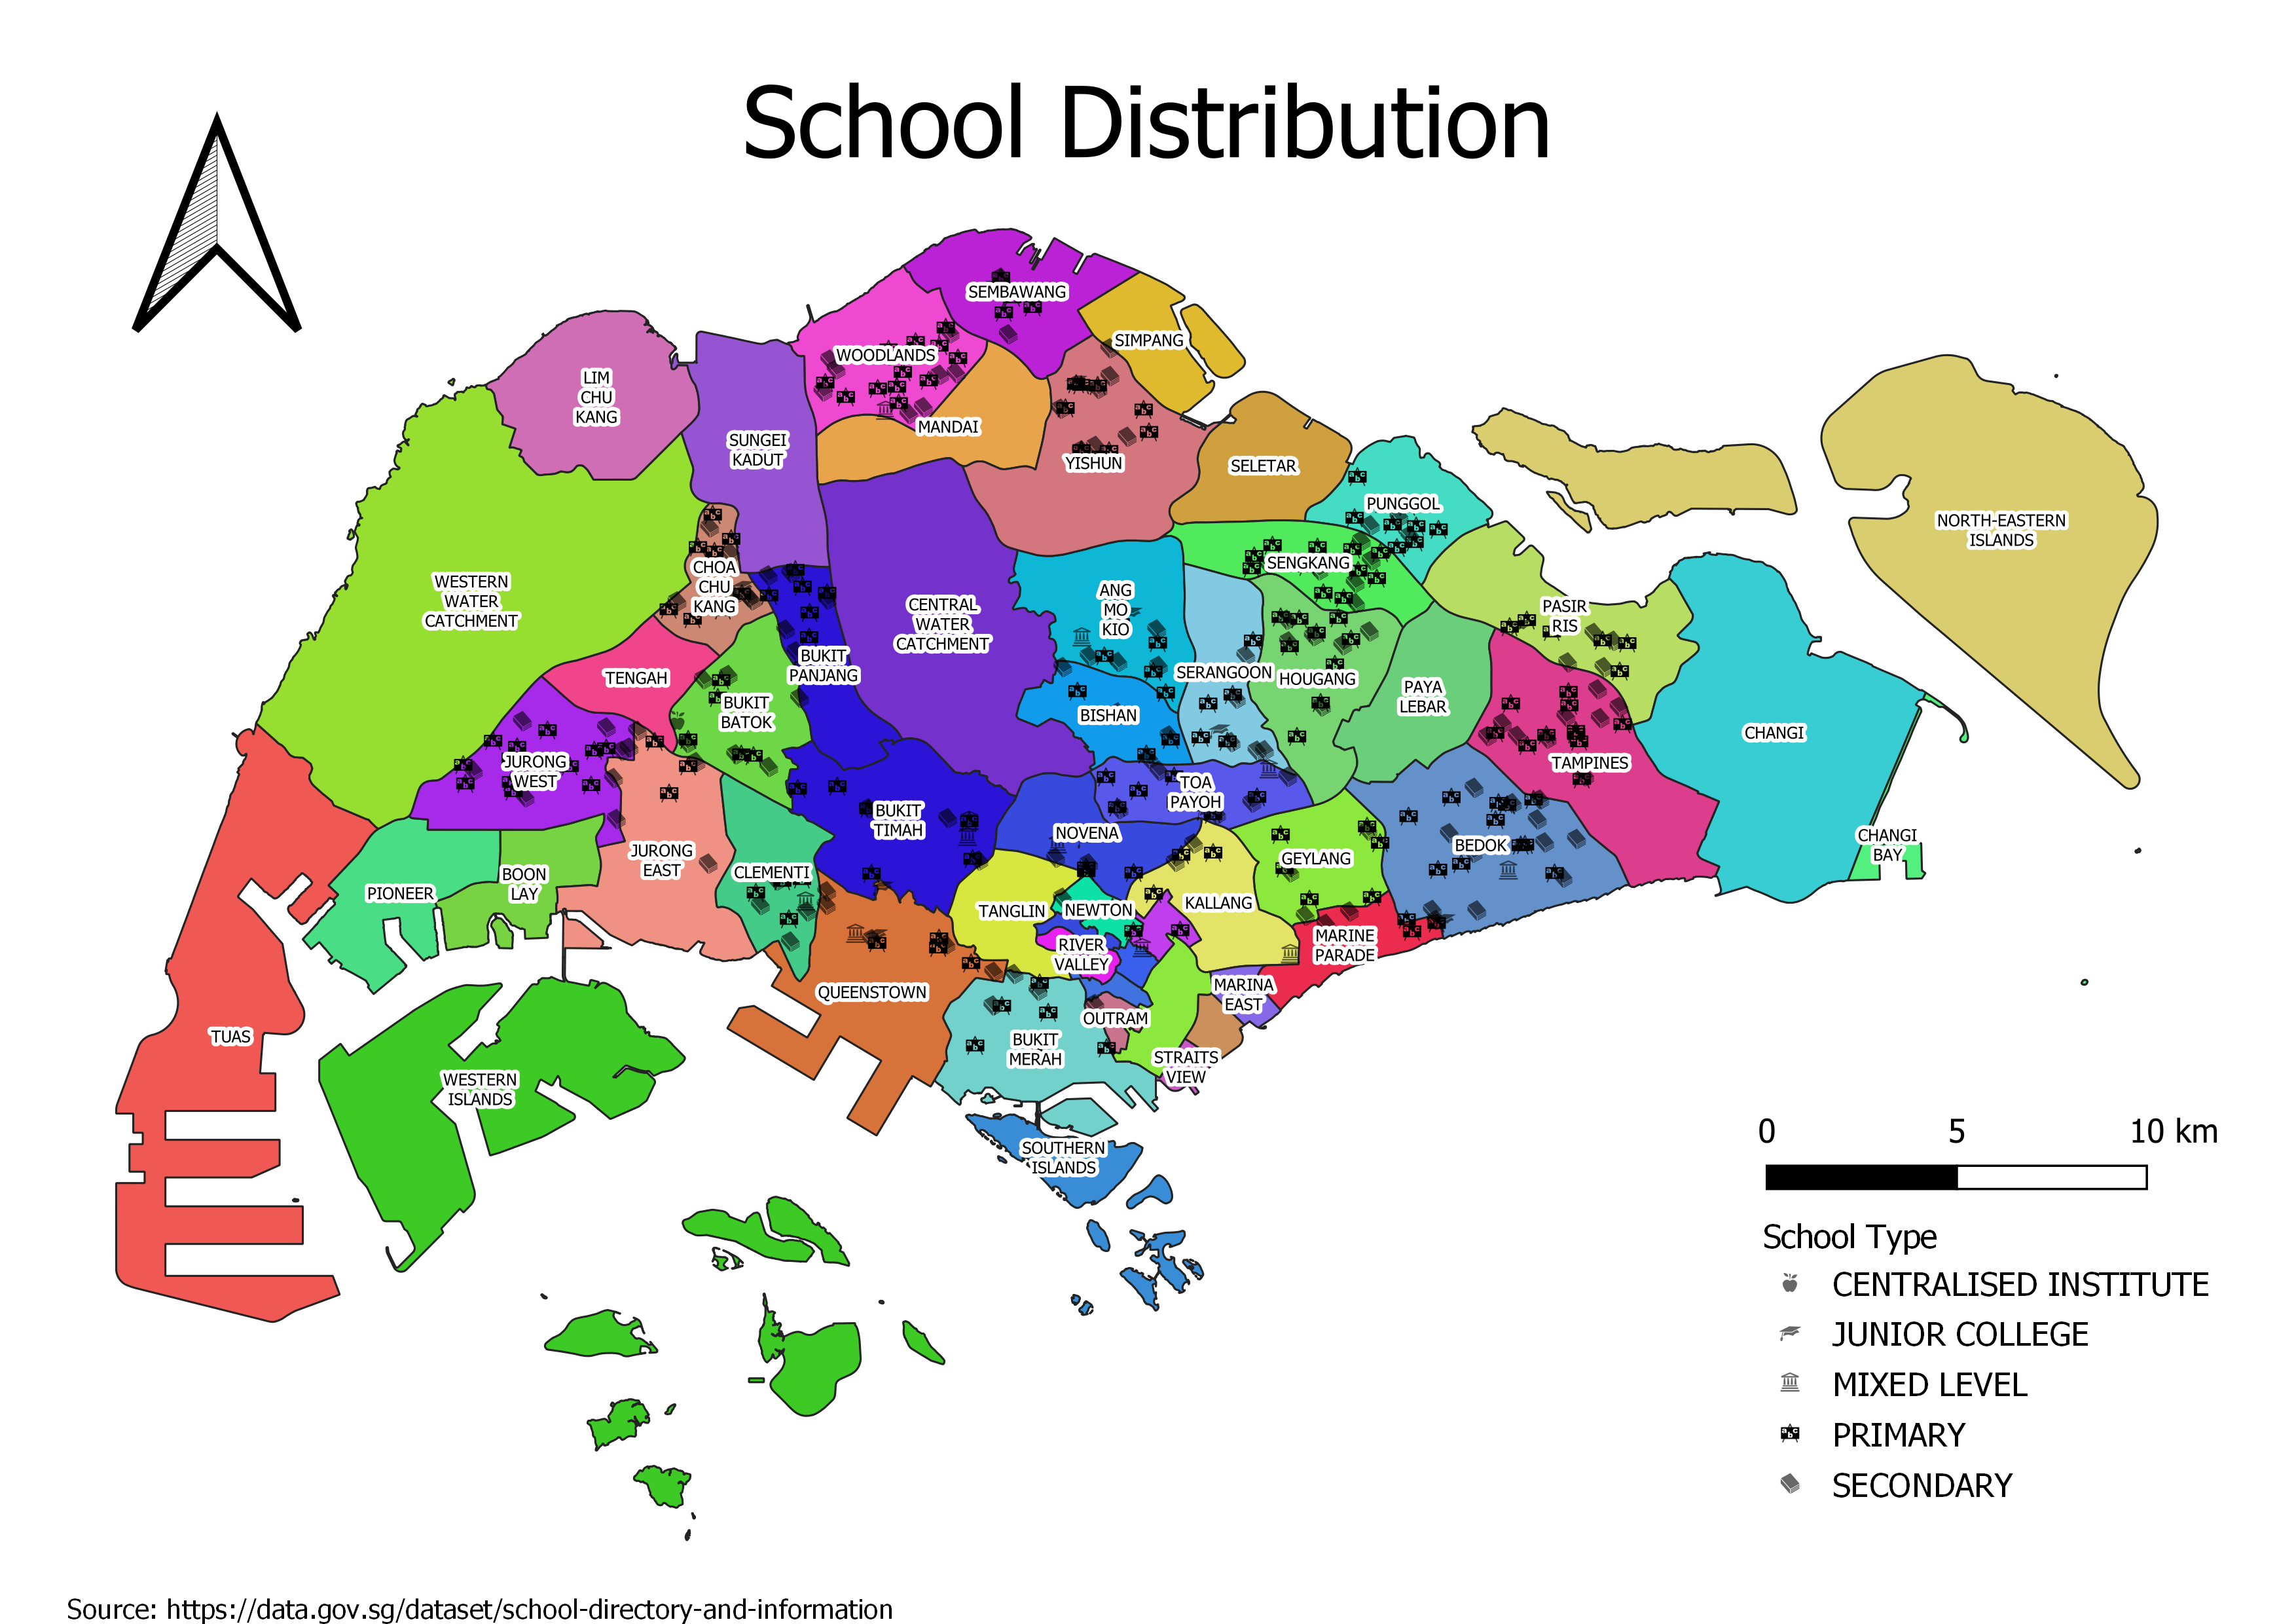
| 17:04, 15 September 2019 | Map1 school.png (file) |  |
684 KB | Shenjie.lim.2018 | Shows the schools in Singapore | 1 |
| 17:01, 15 September 2019 | 2018ProportionAge65+.png (file) |  |
1,012 KB | Lhkhong.2018 | 1 | |
| 17:00, 15 September 2019 | 2010ProportionAge65+ new.jpg (file) |  |
235 KB | Lhkhong.2018 | 1 | |
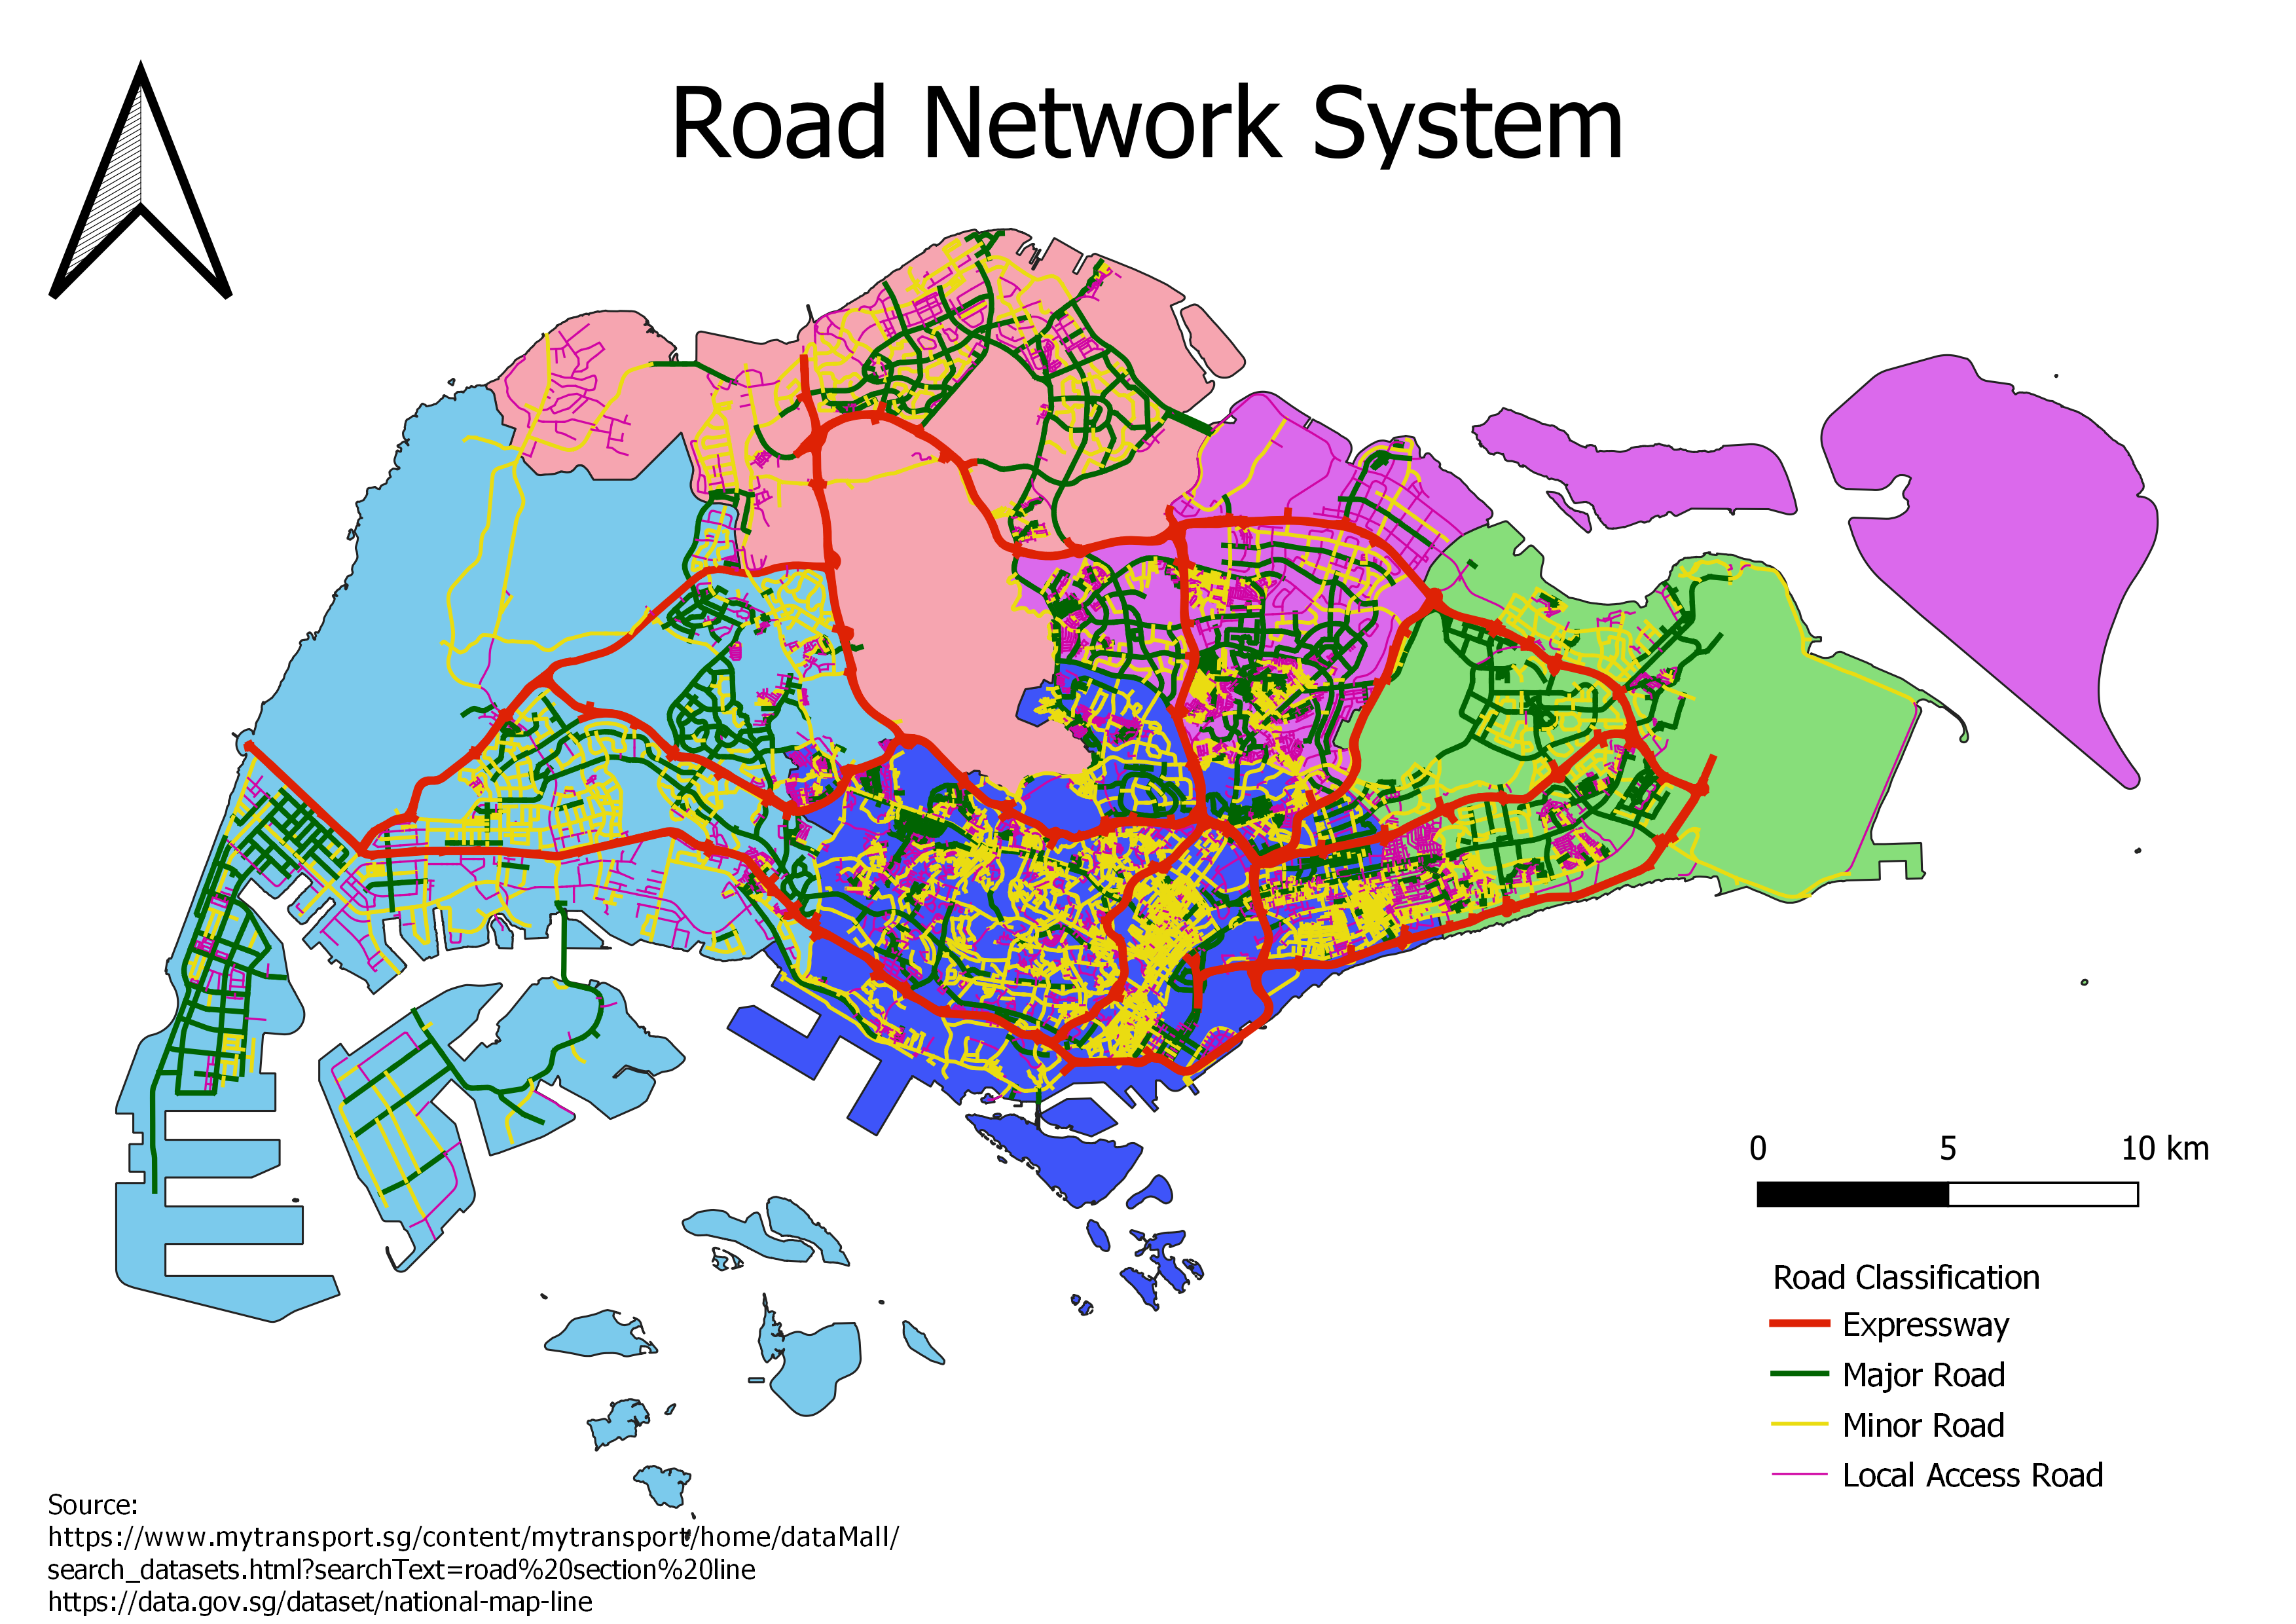
| 16:59, 15 September 2019 | Road.png (file) |  |
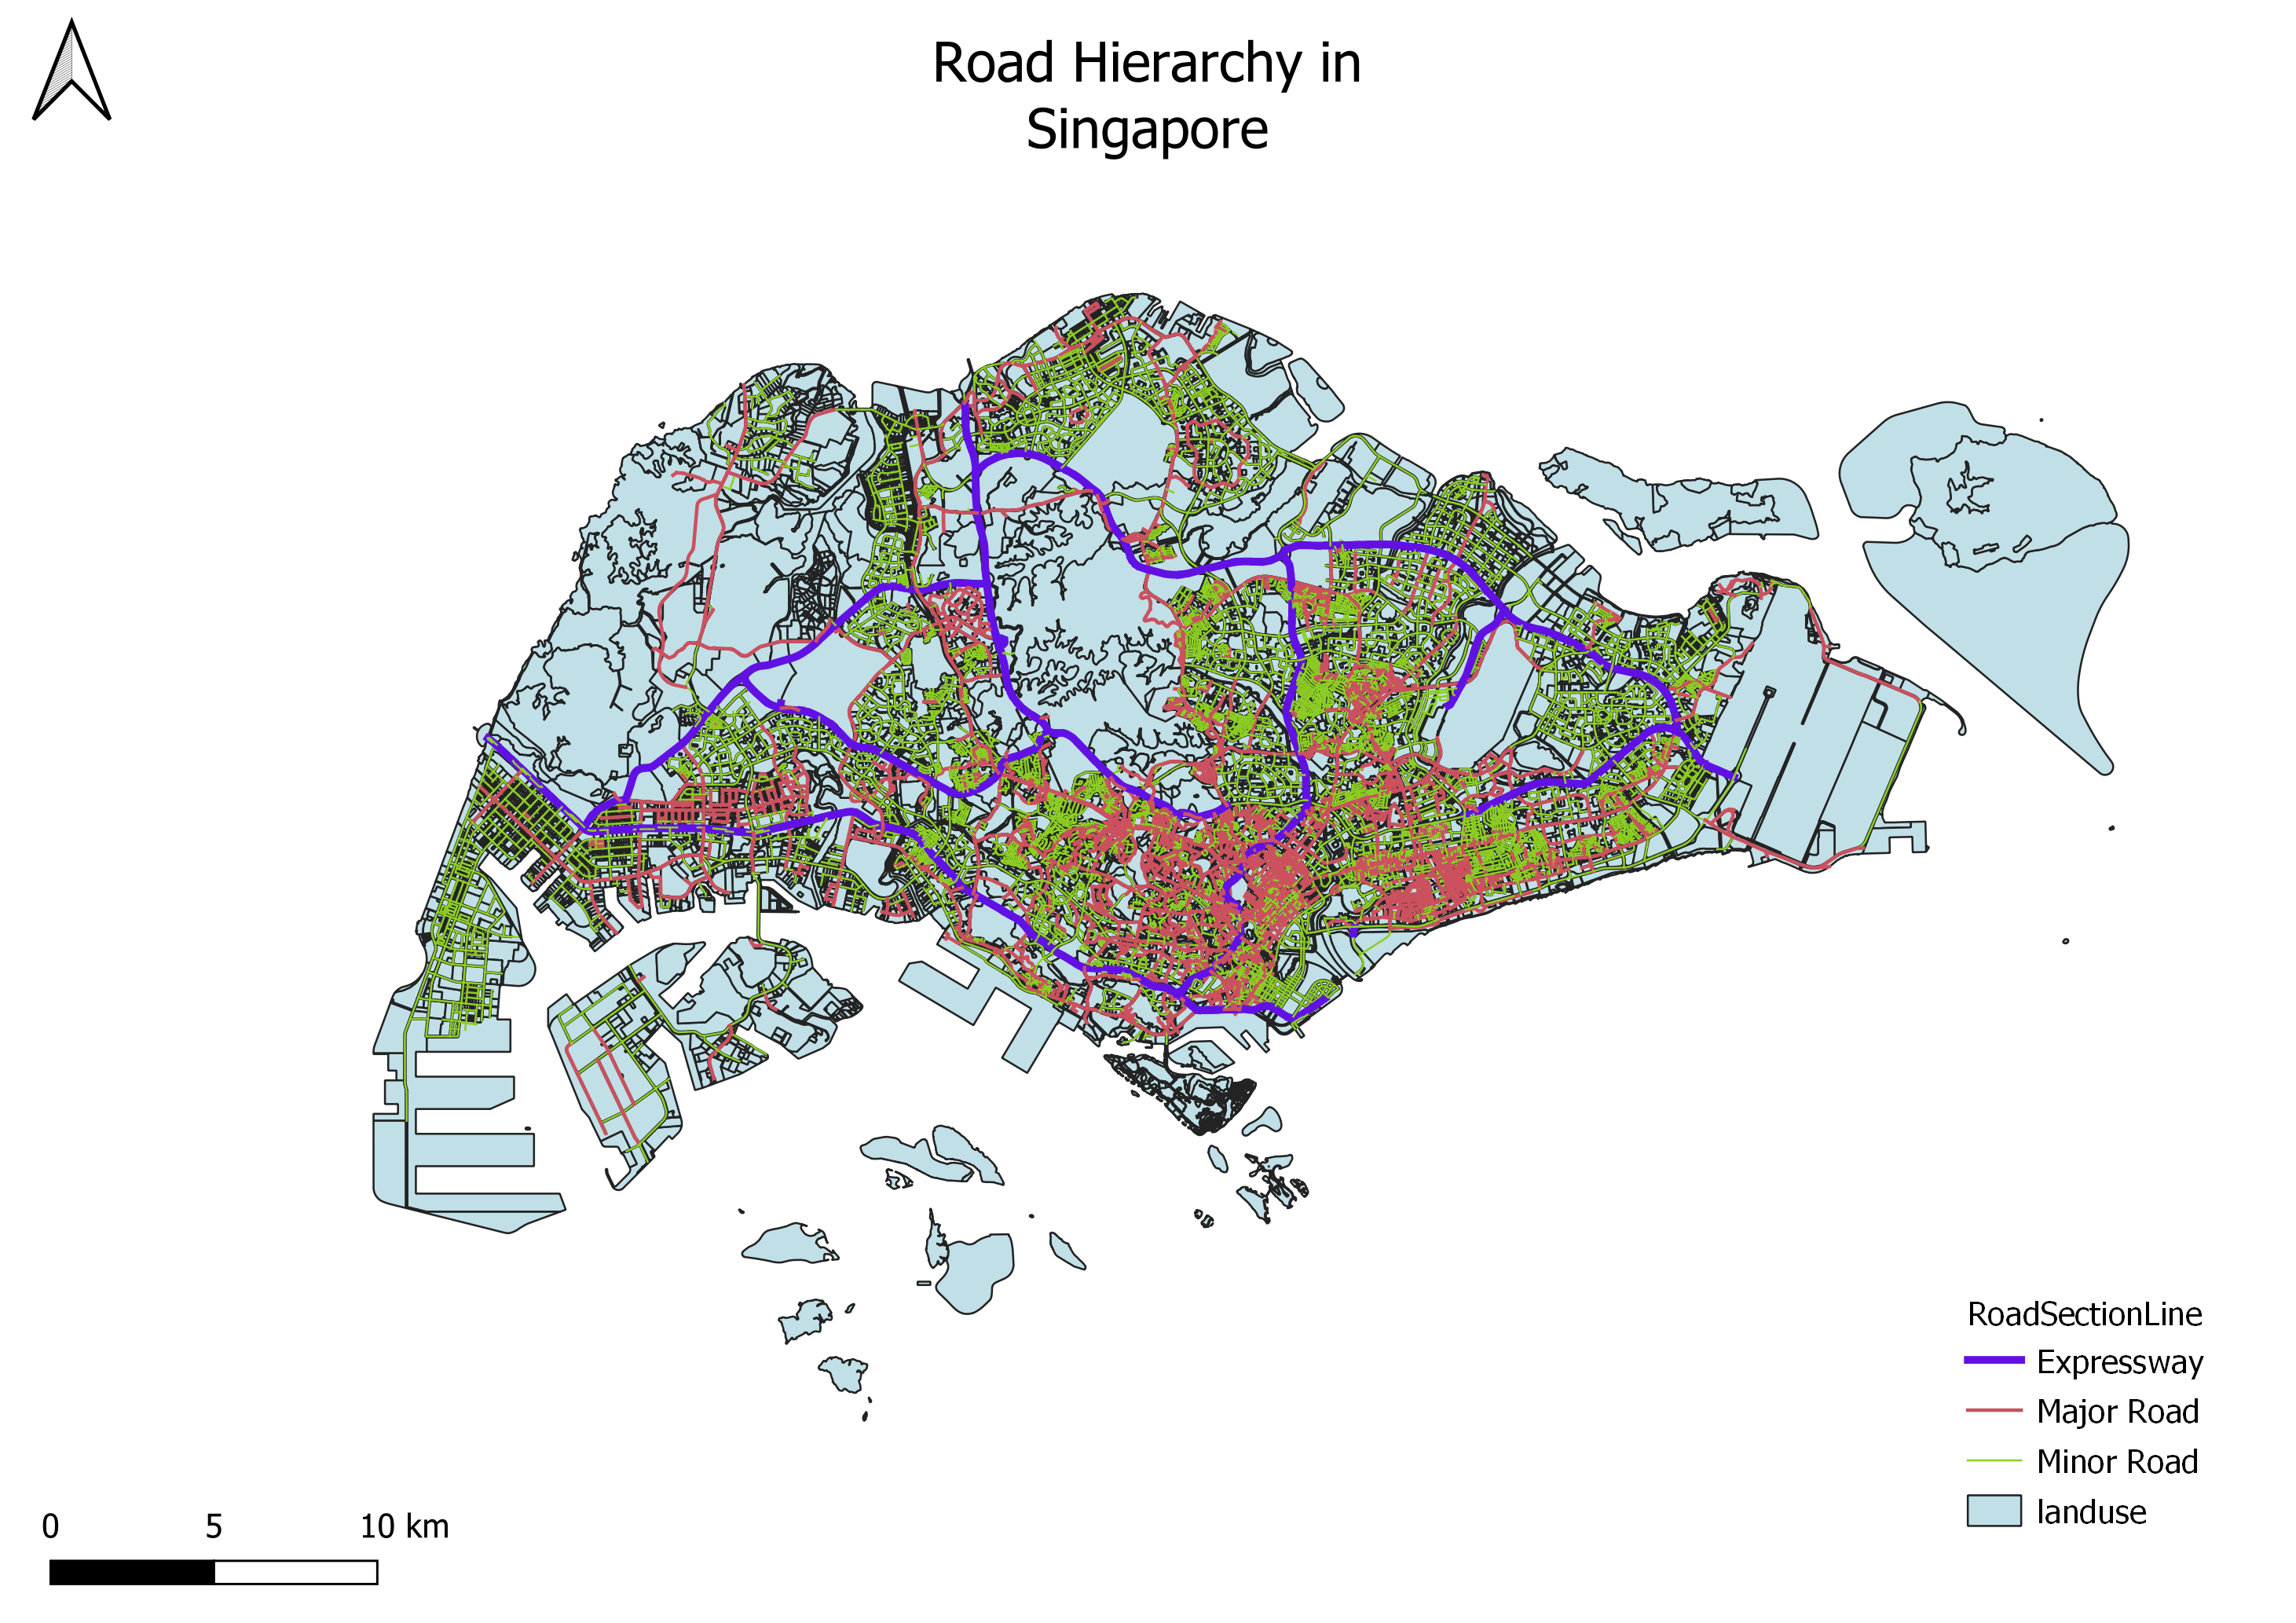
1.92 MB | Vanessa.au.2018 | The different types of roads are represented by different lines of varying widths and colour. | 1 |
| 16:59, 15 September 2019 | School Distribution.png (file) |  |
1.23 MB | Jimmeng.kok.2017 | 1 | |
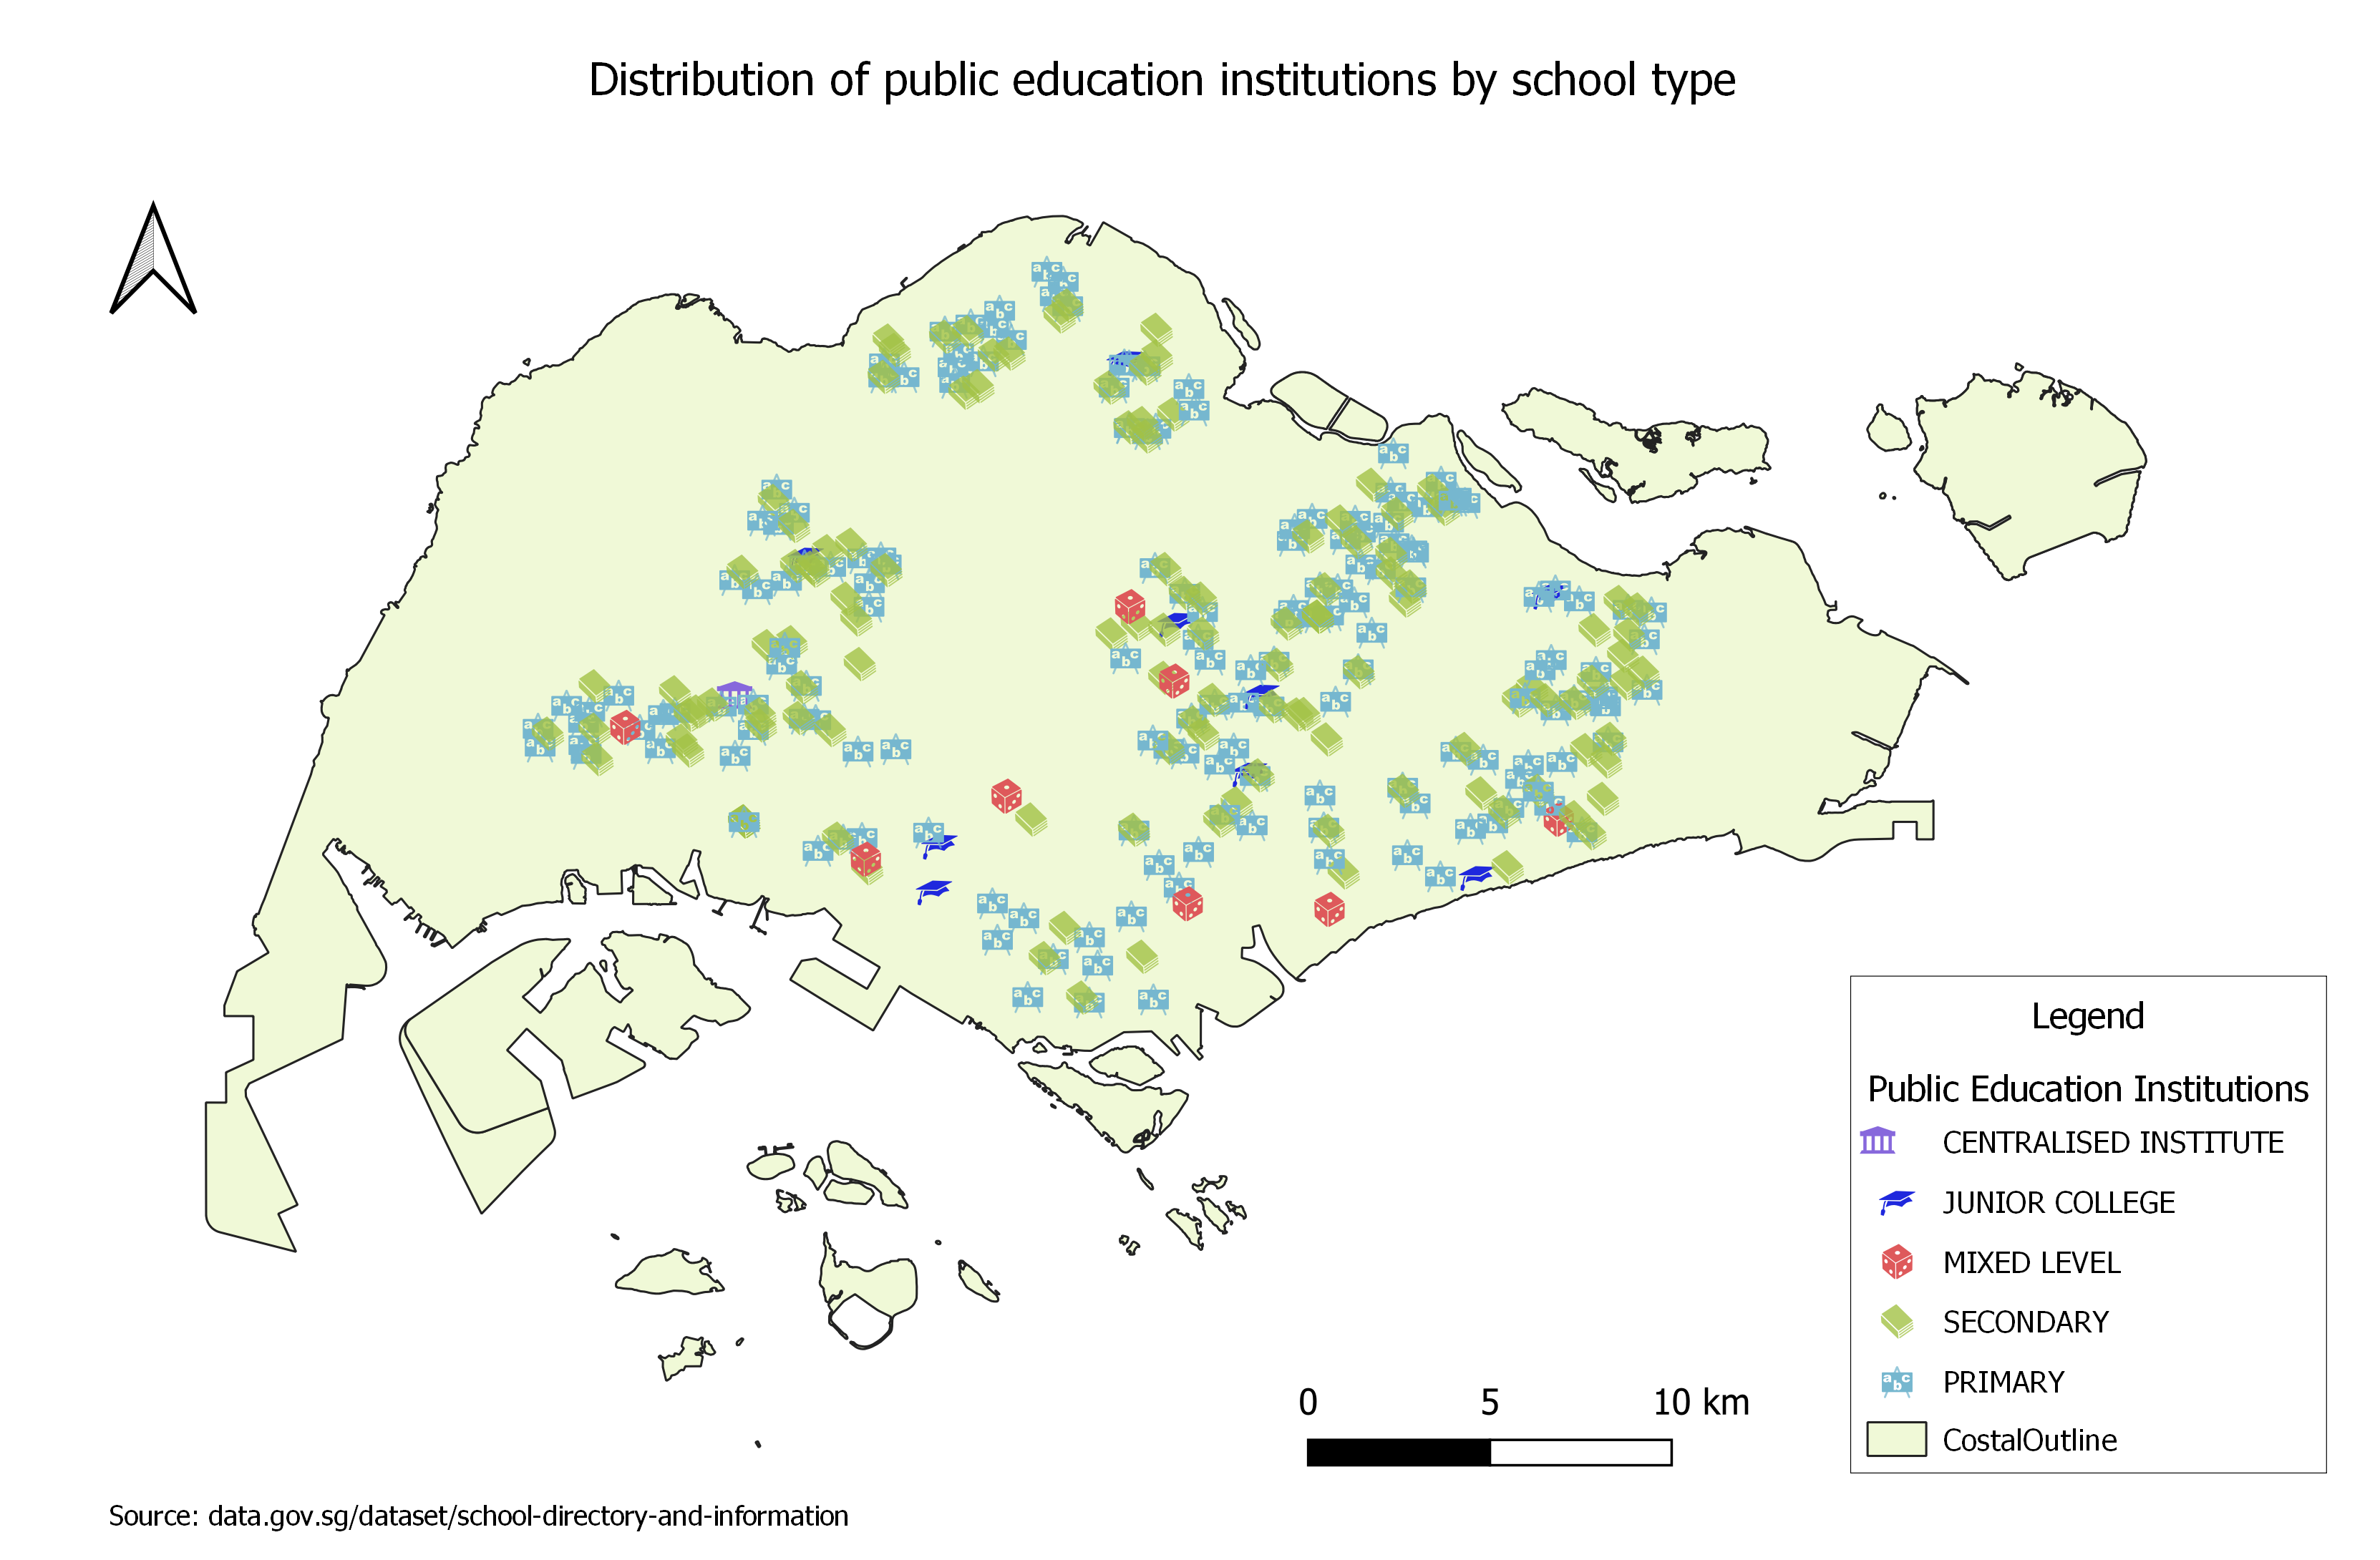
| 16:50, 15 September 2019 | Distribution of Public Institutions in Singapore.png (file) |  |
1.84 MB | Jingyi.ho.2018 | 1 | |
| 16:47, 15 September 2019 | Proportion of aged population 2018.png (file) |  |
168 KB | Yu.zang.2016 | 1 | |
| 16:46, 15 September 2019 | 2010 Aged Population.jpg (file) |  |
285 KB | Sqseah.2018 | 1 | |
| 16:45, 15 September 2019 | %Change20102018.jpg (file) |  |
202 KB | Lhkhong.2018 | 1 | |
| 16:44, 15 September 2019 | P1a-schooldistributionbyregion.jpg (file) |  |
853 KB | Baihe.soh.2018 | 4 | |
| 16:44, 15 September 2019 | School Institutions .jpg (file) |  |
310 KB | Sqseah.2018 | 1 | |
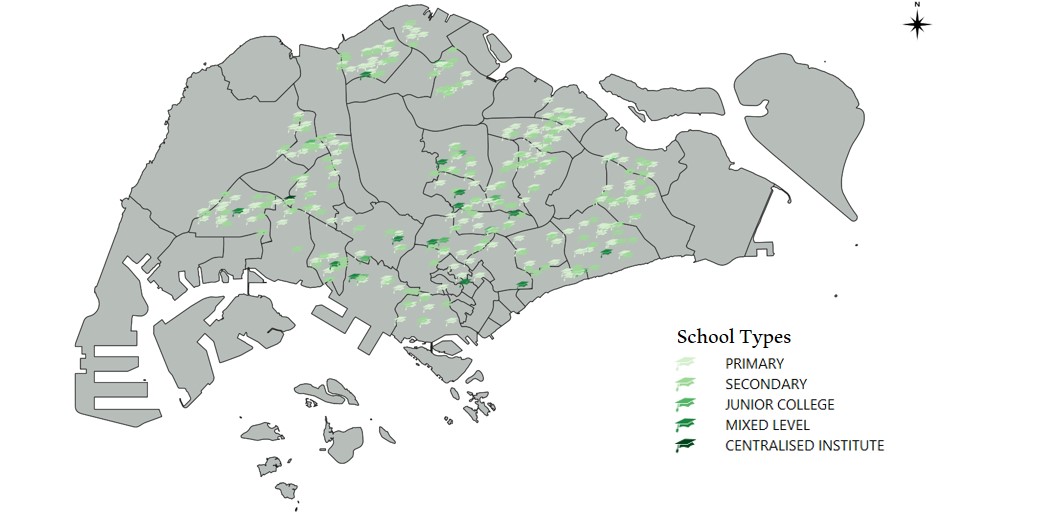
| 16:41, 15 September 2019 | Thematic- SchoolTypes.png (file) |  |
184 KB | Eugene.kim.2018 | 1 | |
| 16:39, 15 September 2019 | 2010ProportionAge65+.png (file) |  |
1.02 MB | Lhkhong.2018 | 1 | |
| 16:38, 15 September 2019 | Proportion of aged population 2010.png (file) |  |
183 KB | Yu.zang.2016 | 1 | |
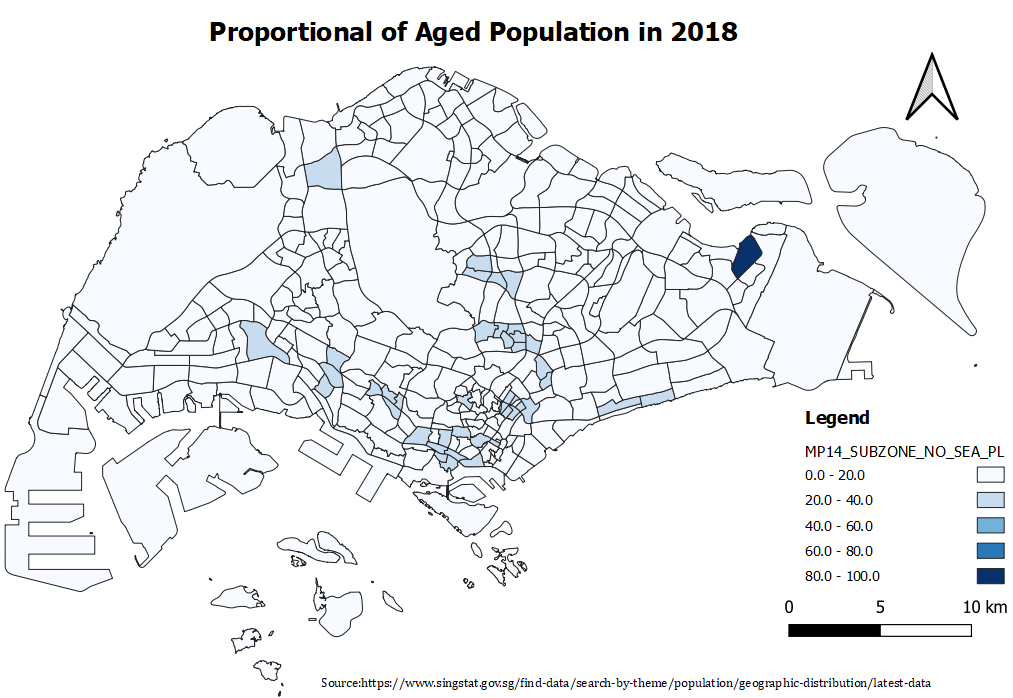
| 16:37, 15 September 2019 | Population 2018.png (file) |  |
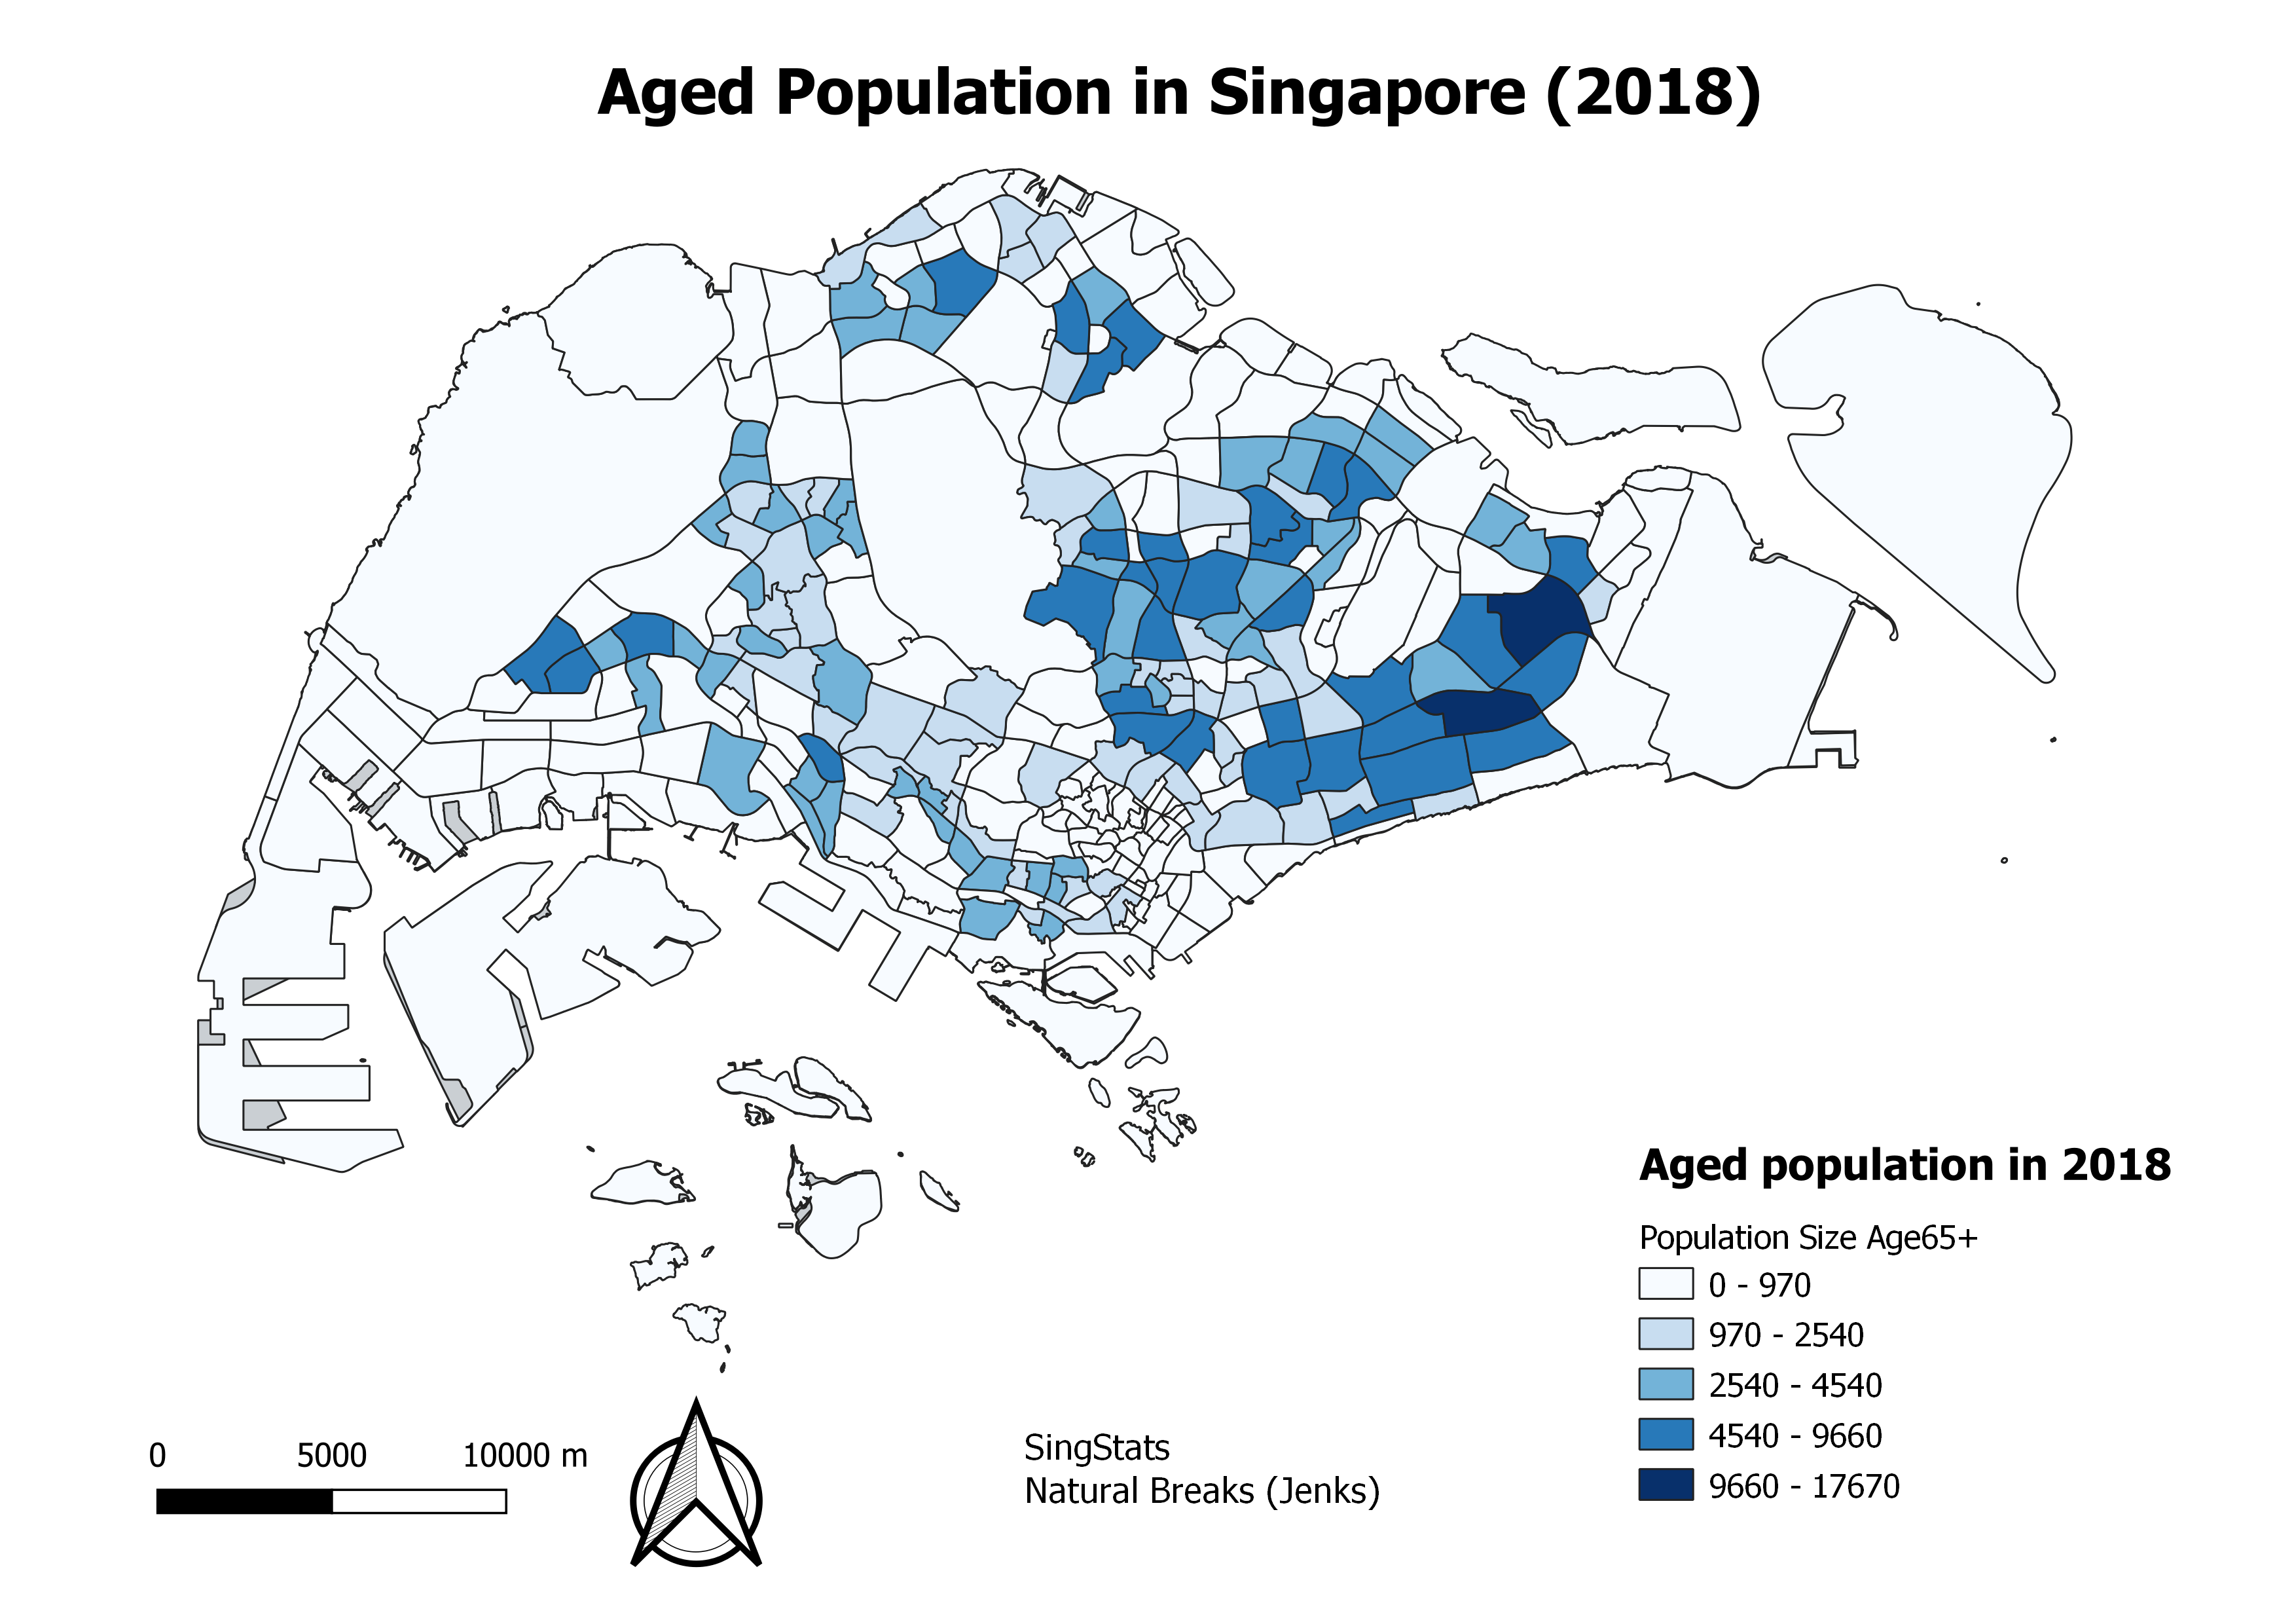
707 KB | Vanessa.au.2018 | This map shows the distribution of the population aged 65 years old and above in 2018. The varying intensity of colours indicate the number of people aged 65+ in each planning subzone. Darker intensity highlights that the planning subzone has a higher... | 1 |
| 16:35, 15 September 2019 | Photo6334574753393781277.jpg (file) |  |
352 KB | Sqseah.2018 | 1 | |
| 16:32, 15 September 2019 | Population 2010.png (file) |  |
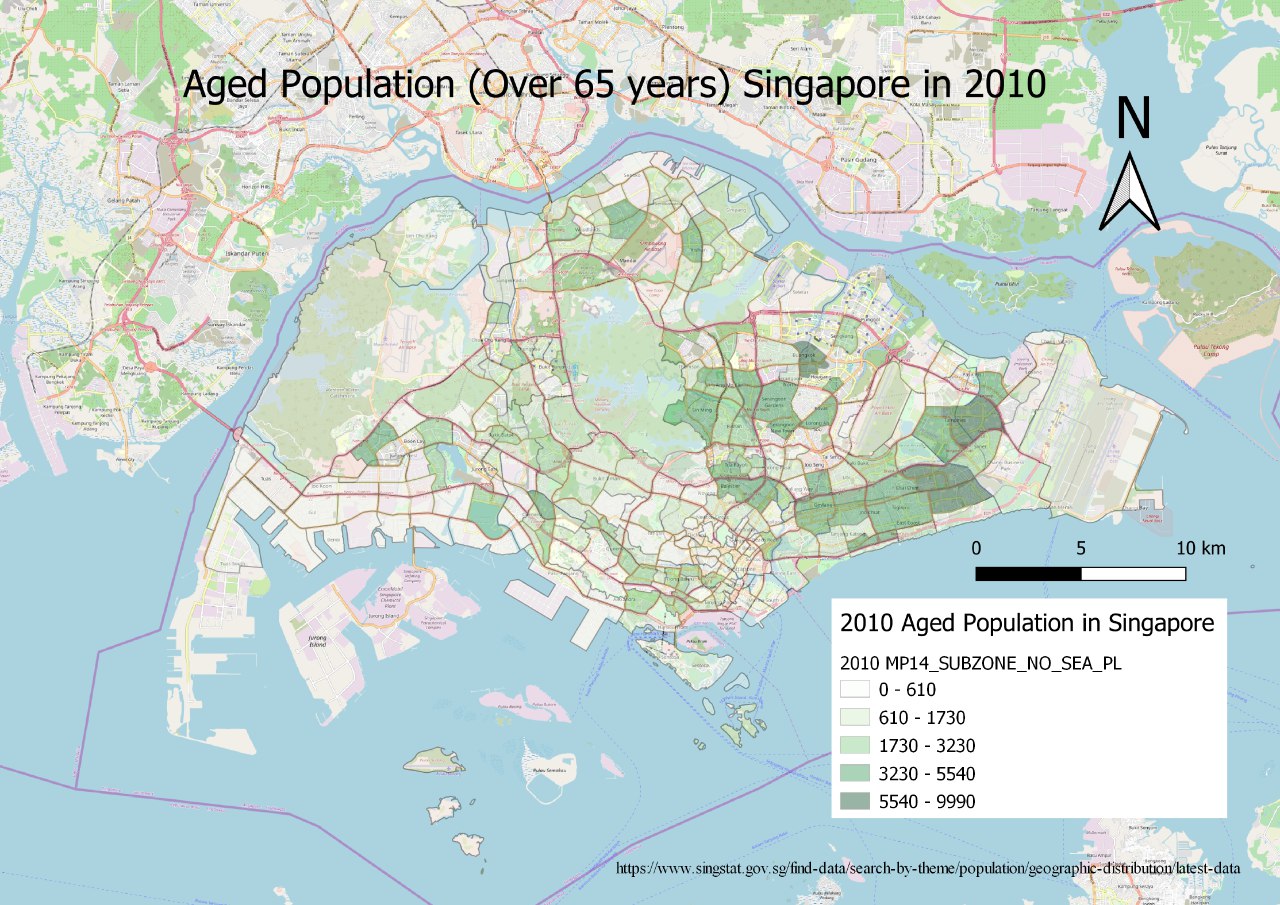
735 KB | Vanessa.au.2018 | This map shows the distribution of the population aged 65 years old and above in 2010. The varying intensity of colours indicate the number of people aged 65+ in each planning subzone. Darker intensity highlights that the planning area has a higher num... | 1 |
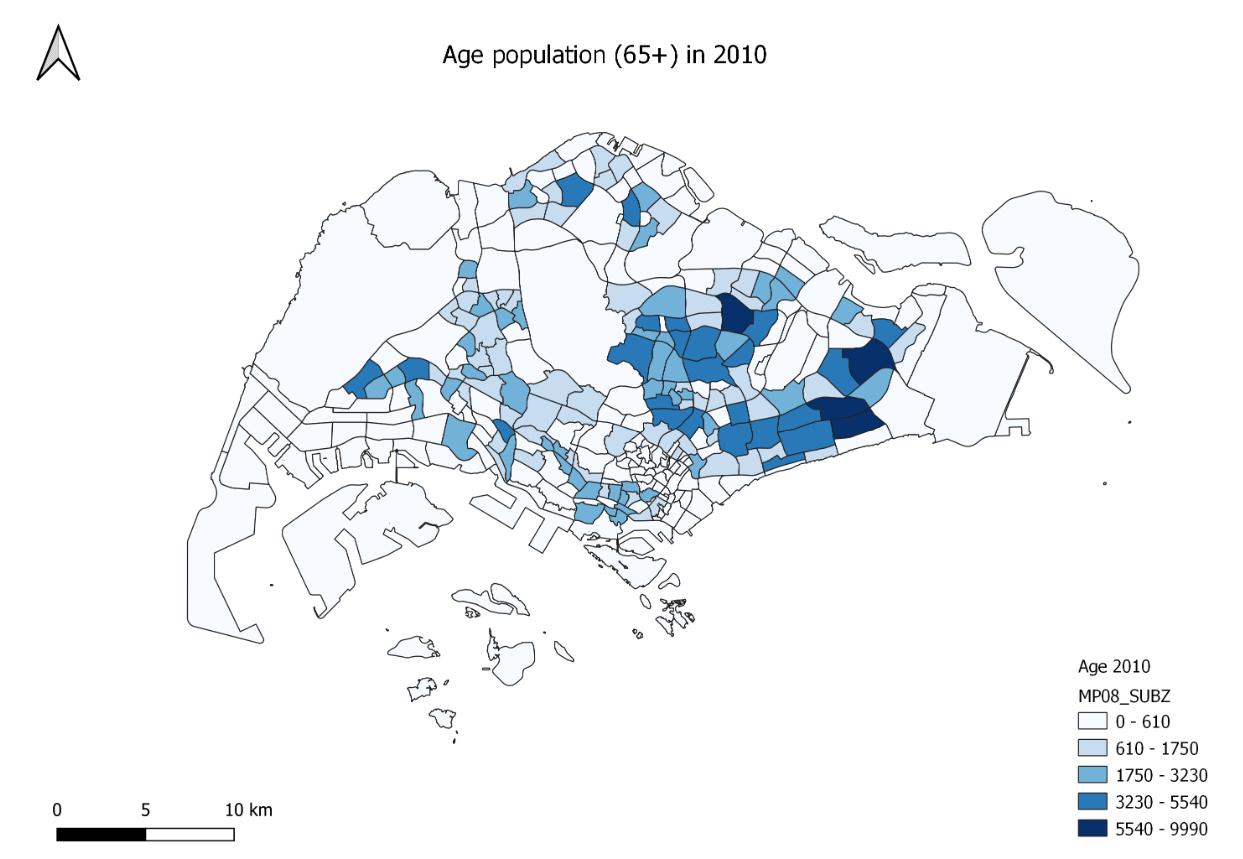
| 16:29, 15 September 2019 | Age 2010.png (file) |  |
735 KB | Vanessa.au.2018 | This map shows the distribution of the population aged 65 years old and above in 2010. The varying intensity of colours indicate the number of people aged 65+ in each planning subzone. Darker intensity highlights that the planning area has a higher num... | 1 |
| 16:29, 15 September 2019 | Thematic - SchoolTypes.jpg (file) |  |
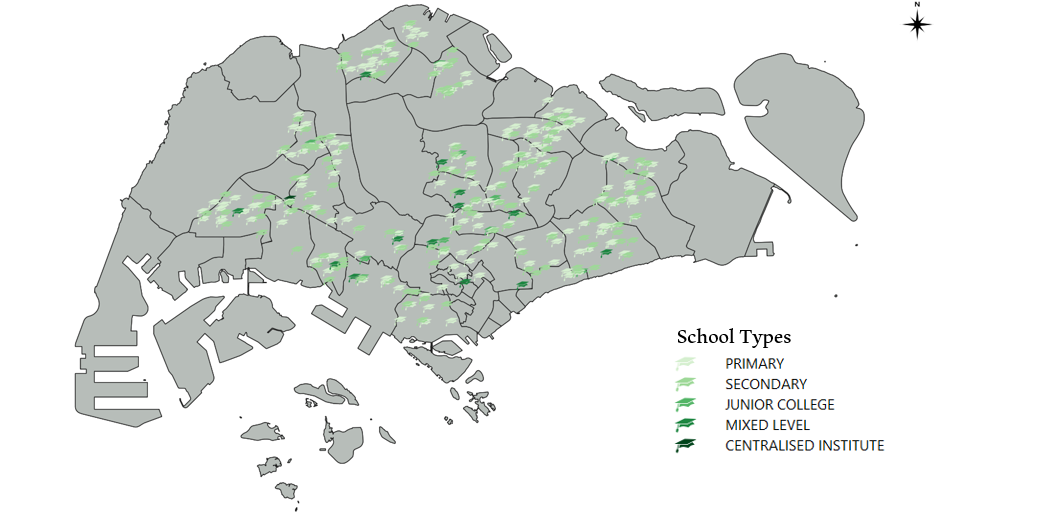
78 KB | Eugene.kim.2018 | Thematic Mapping - School Types | 1 |
| 16:23, 15 September 2019 | Road Network System Kang Hui Yun.png (file) |  |
1.96 MB | Huiyun.kang.2016 | 2 | |
| 16:22, 15 September 2019 | Public Schools.png (file) |  |
1.12 MB | Huiyun.kang.2016 | Used region base instead of coastal outline | 3 |
| 16:18, 15 September 2019 | Leandra school type.png (file) |  |
856 KB | Leandralee.2018 | 2 | |
| 16:15, 15 September 2019 | Q2 Part 2b(1).png (file) | .png) |
1,014 KB | Jolene.pek.2018 | 1 | |
| 16:14, 15 September 2019 | Road hierarchy.png (file) |  |
1.92 MB | Vanessa.au.2018 | The different lines of varying widths and colours represent the different types of roads in Singapore, namely the expressways, major roads and minor roads. | 1 |
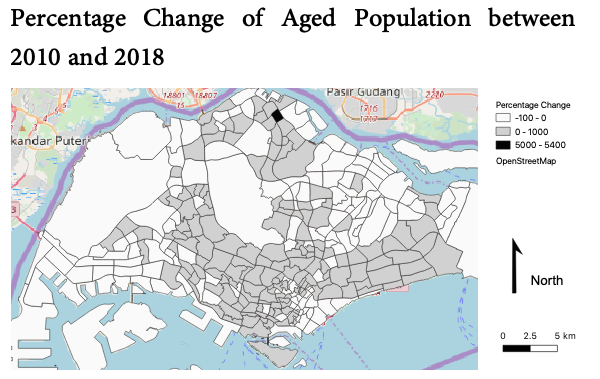
| 16:14, 15 September 2019 | Percentage Change in Aged Population between 2010 and 2018.png (file) |  |
1.35 MB | Bcheng.2018 | 1 | |
| 16:12, 15 September 2019 | 2018AgeGenderMap.png (file) |  |
1.03 MB | Lhkhong.2018 | 1 | |
| 16:12, 15 September 2019 | 2018 Proportion of Aged Population in Singapore.png (file) |  |
1.47 MB | Bcheng.2018 | 1 | |
| 16:10, 15 September 2019 | 2010 Proportion of Aged Population in Singapore.png (file) |  |
1.13 MB | Bcheng.2018 | 1 | |
| 16:08, 15 September 2019 | Singapore 2014 Master Plan Landuse.png (file) |  |
952 KB | Jerome.quah.2018 | 1 | |
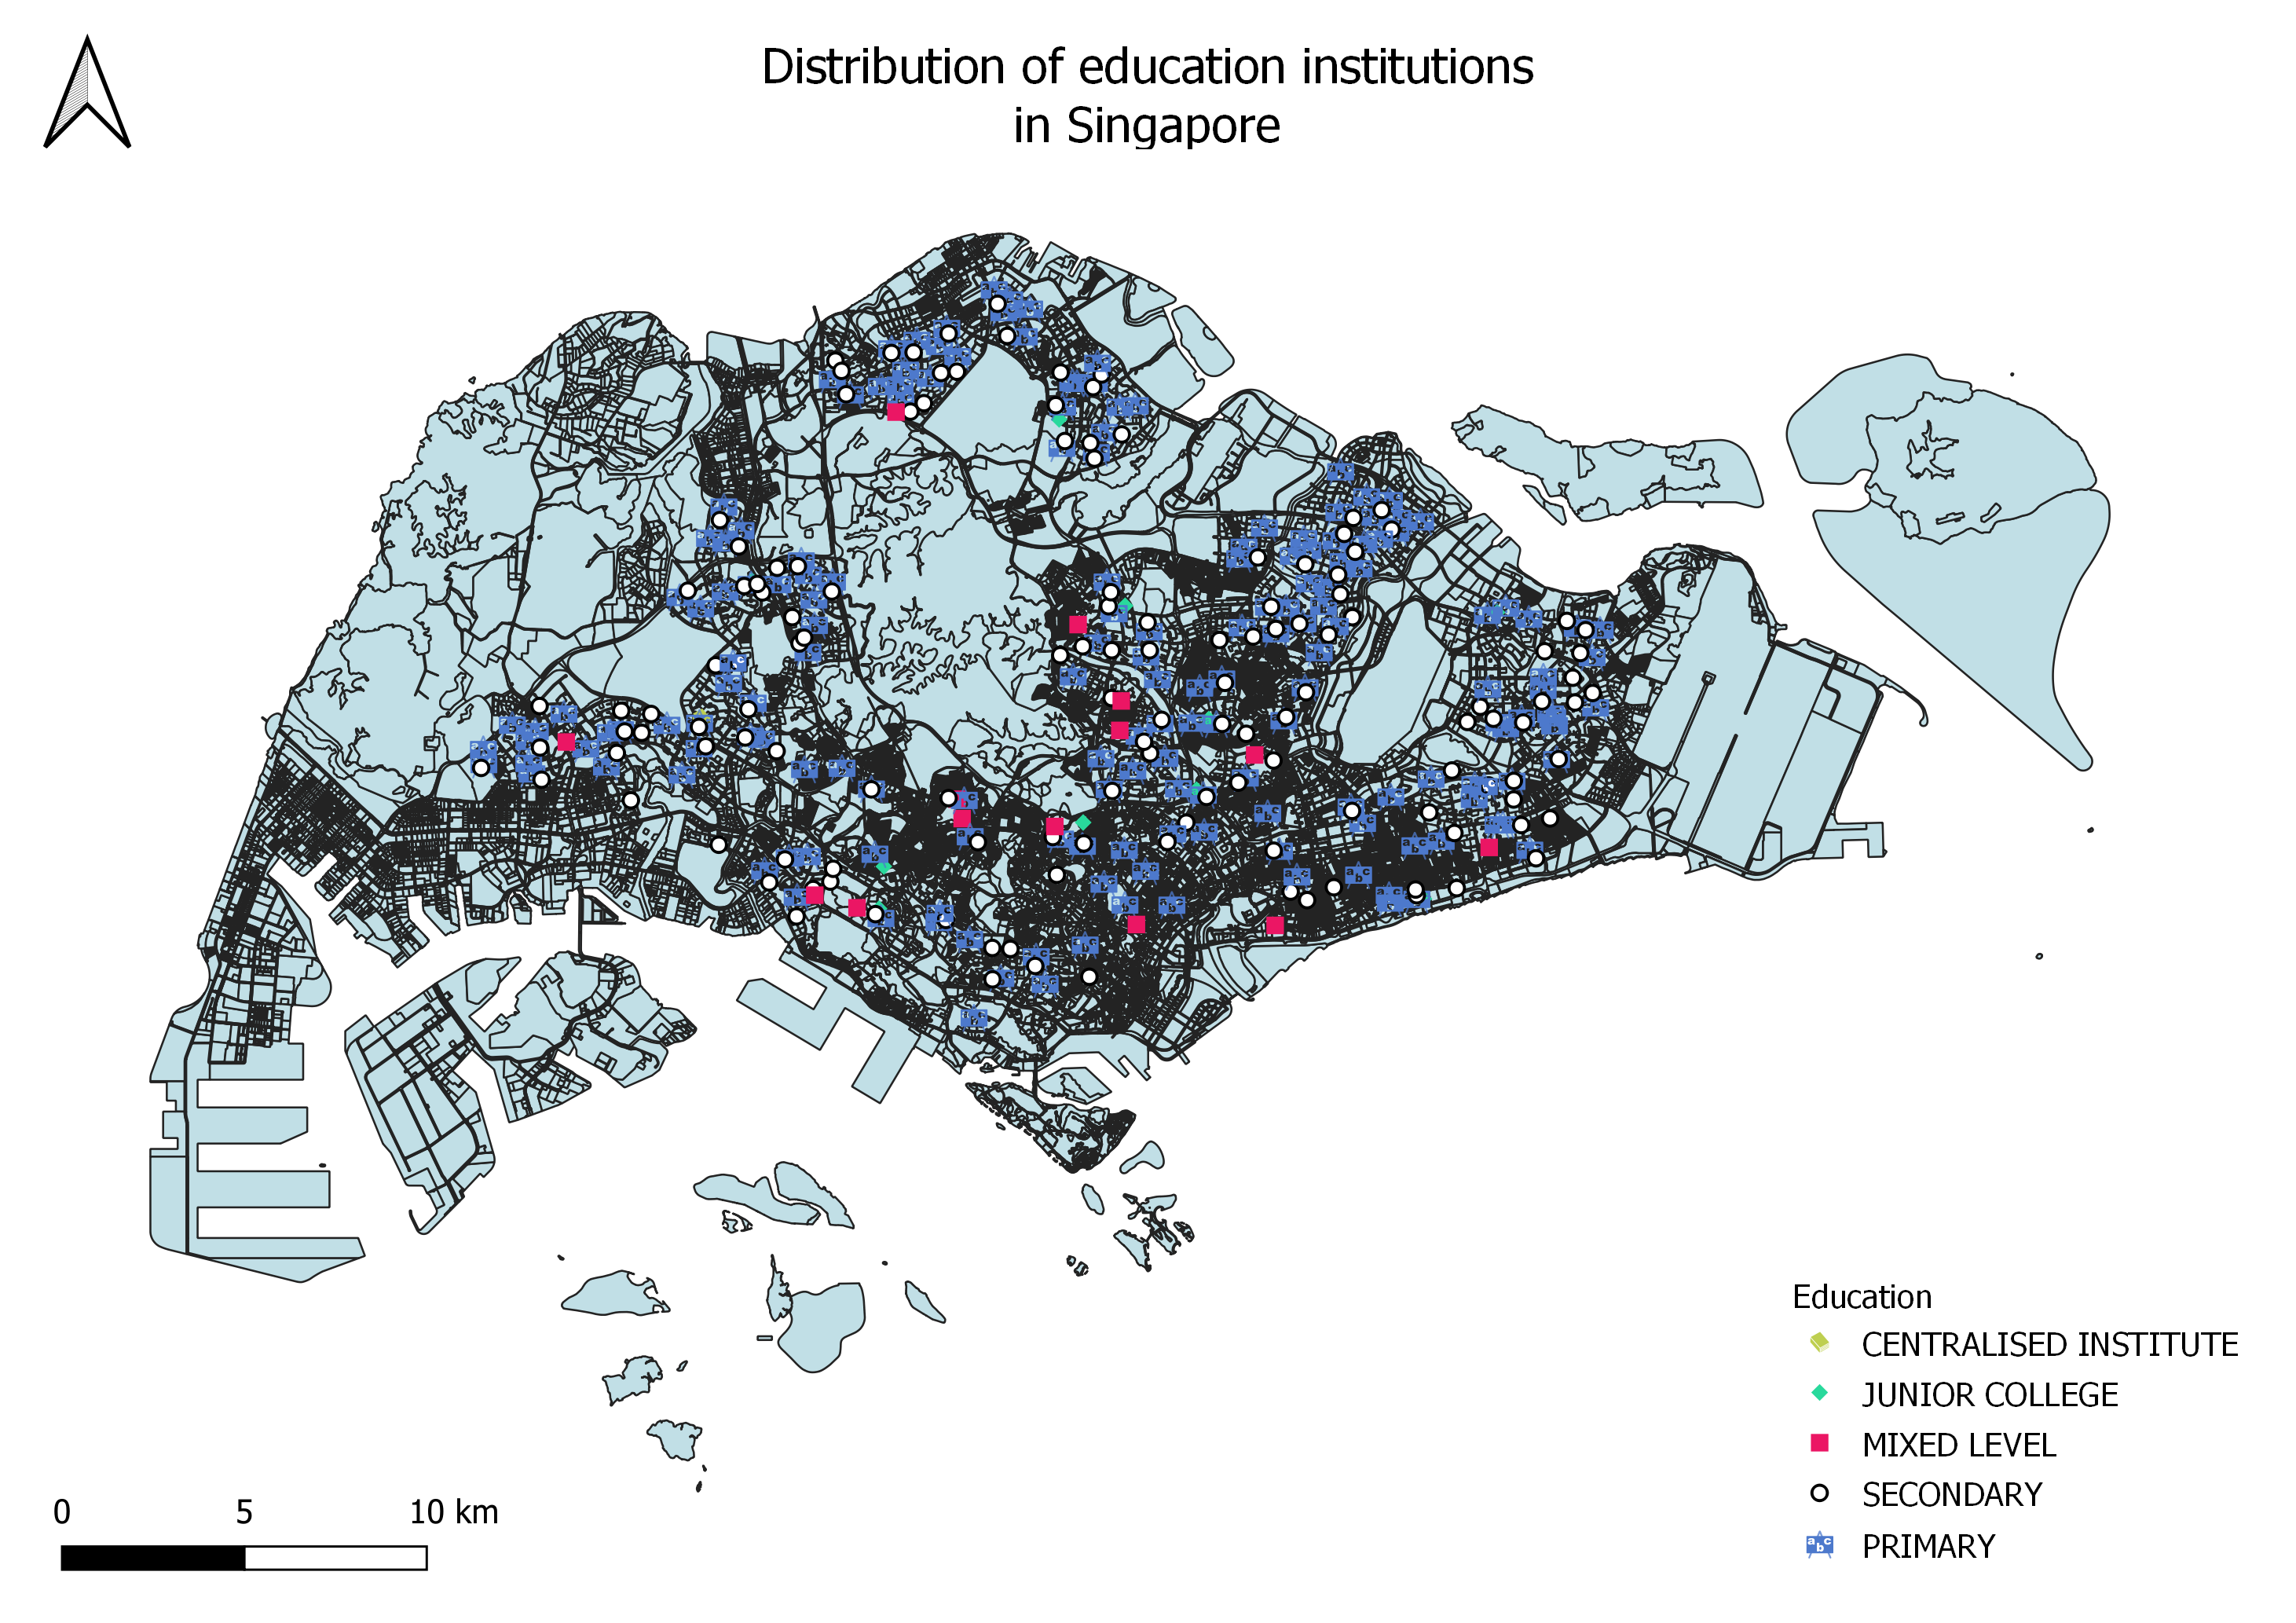
| 16:07, 15 September 2019 | Education.jpg (file) |  |
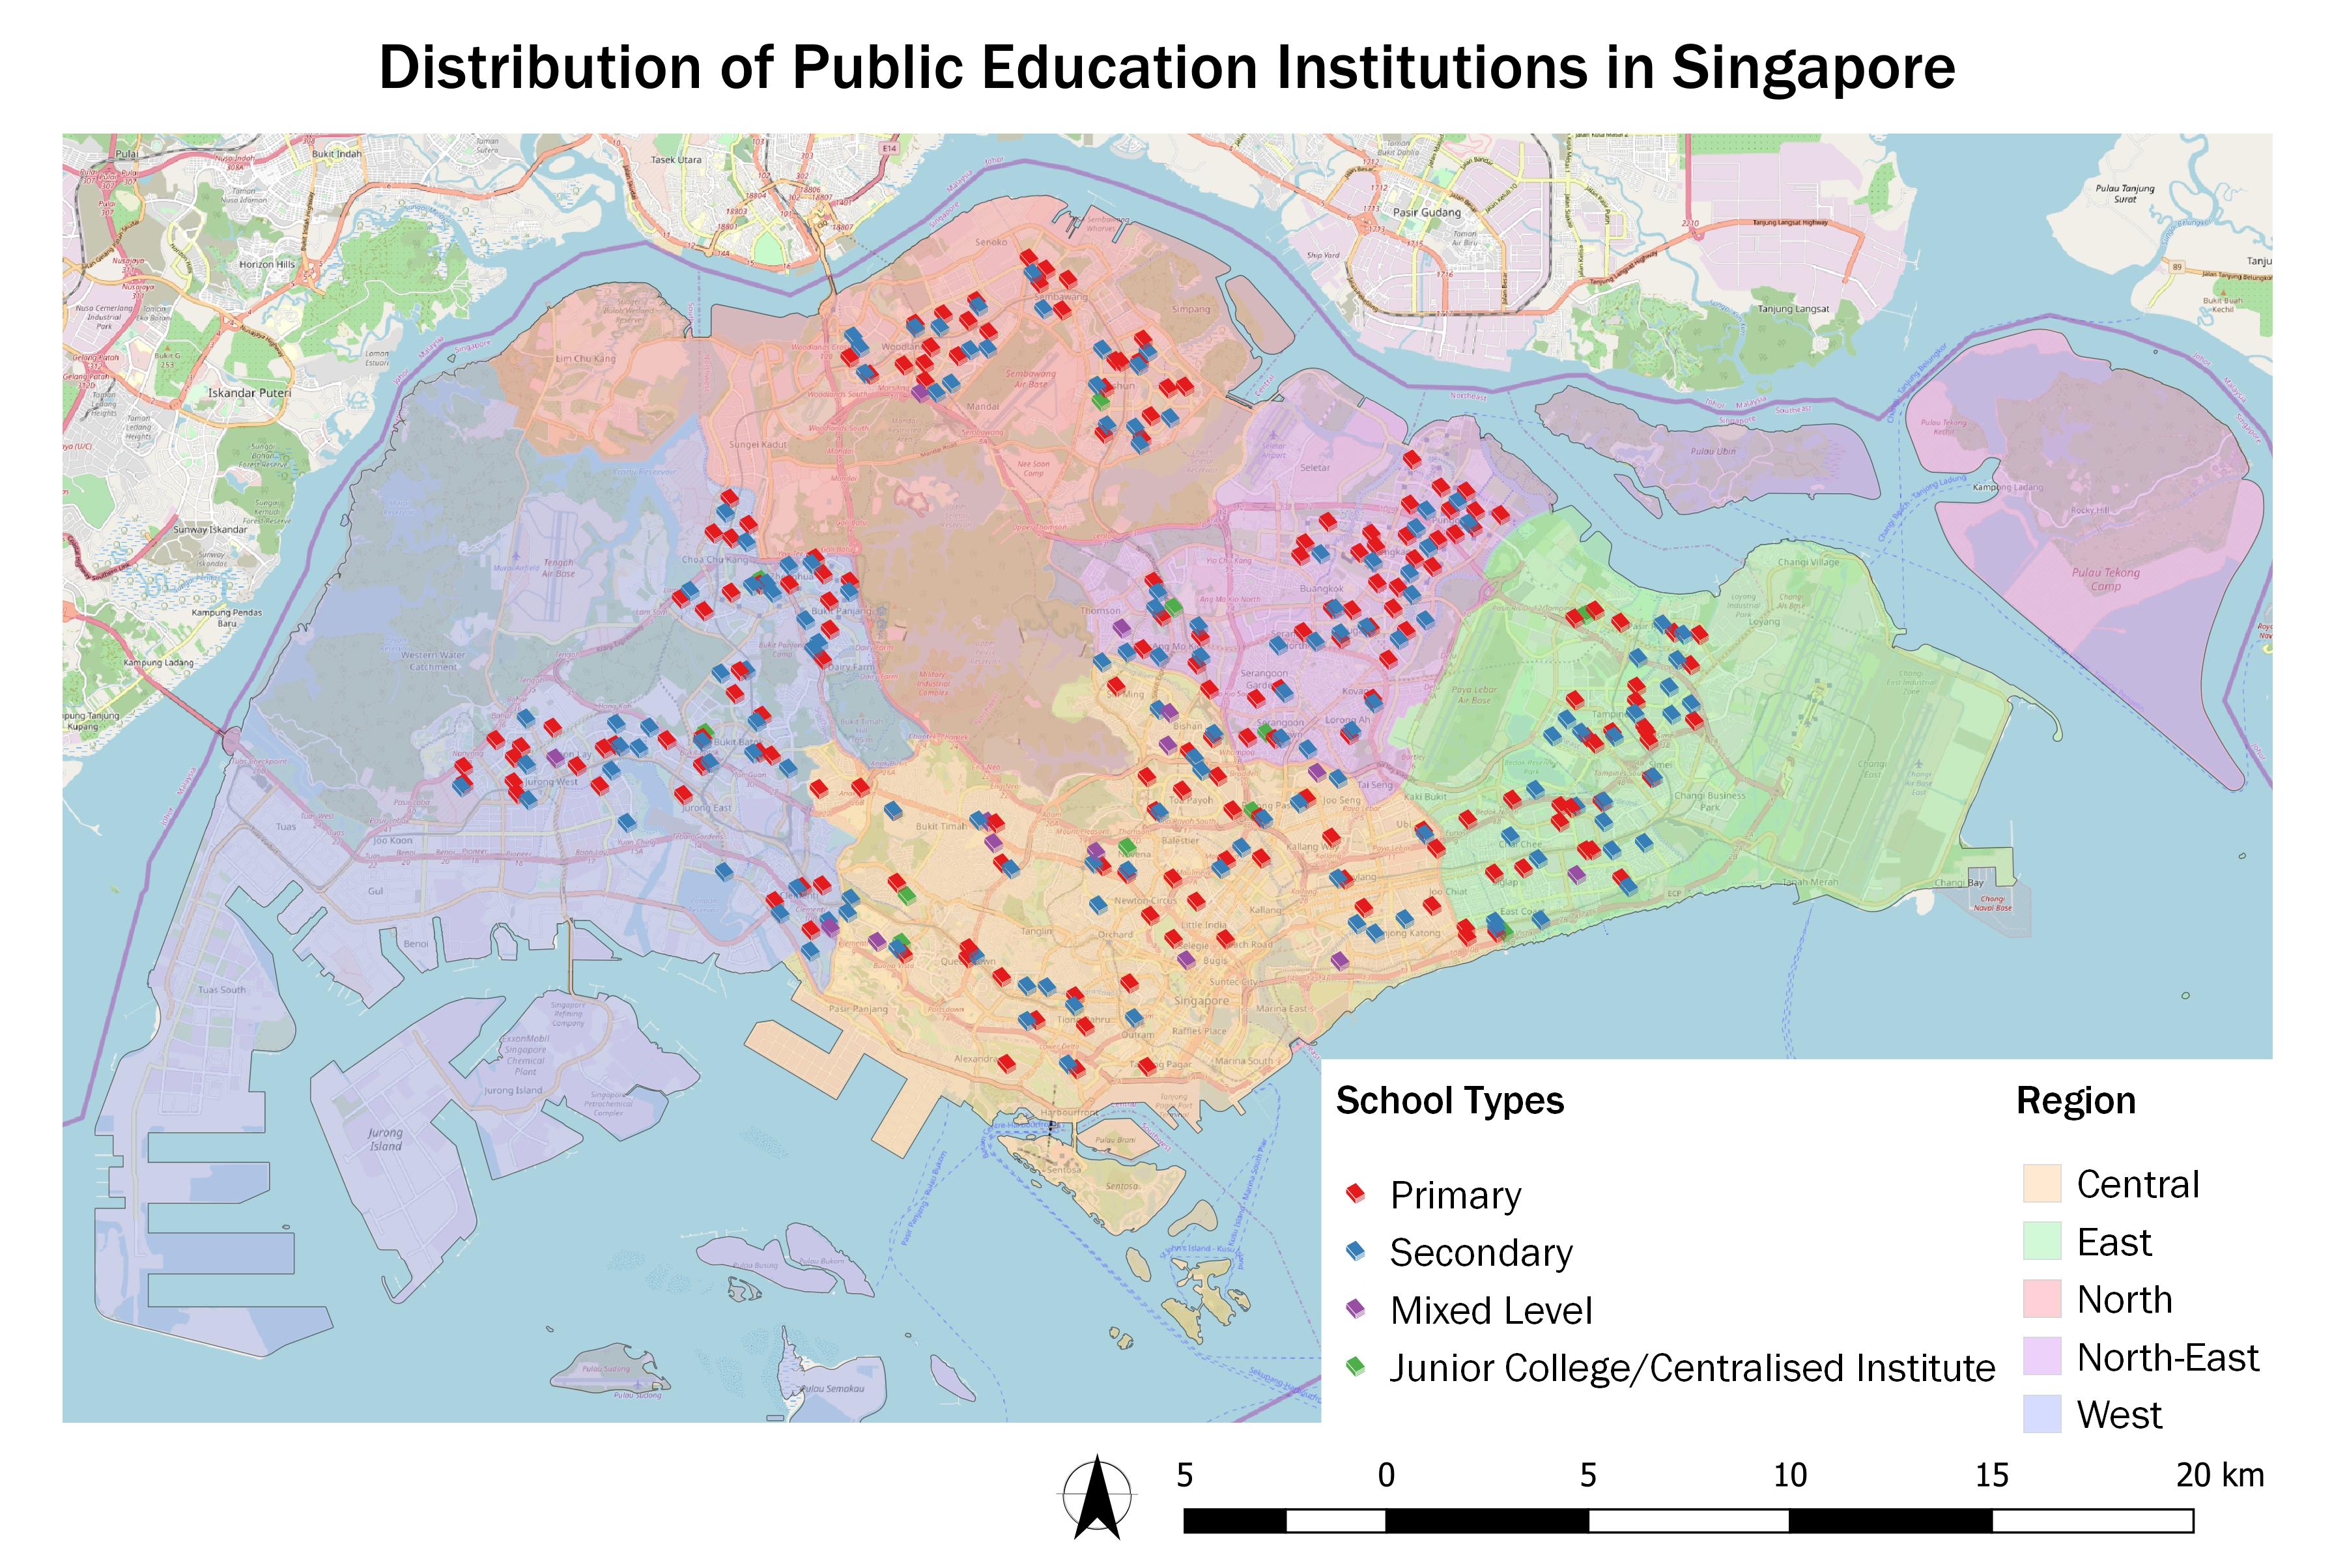
1.73 MB | Vanessa.au.2018 | The Education layer and the MP14 Landuse layer can be seen in this image. The different SVG markers represent the different types of educational institutes in Singapore. | 1 |
| 16:07, 15 September 2019 | 2010AgeGenderMap.png (file) |  |
1,015 KB | Lhkhong.2018 | 1 | |
| 16:02, 15 September 2019 | PercentageChange confirmed.jpg (file) |  |
575 KB | Genice.goh.2018 | 1 | |
| 16:00, 15 September 2019 | Percent Christine.png (file) |  |
164 KB | Jttan.2018 | 1 | |
| 15:59, 15 September 2019 | 2018pro Christine.png (file) |  |
182 KB | Jttan.2018 | 1 |