Uncategorised files
Jump to navigation
Jump to search
Showing below up to 50 results in range #2,001 to #2,050.
View (previous 50 | next 50) (20 | 50 | 100 | 250 | 500)
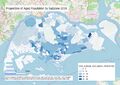
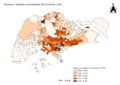
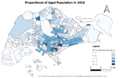
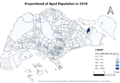
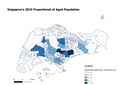
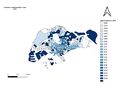
 Proportion of Aged Population 2018 .jpg 3,507 × 2,480; 876 KB
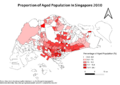
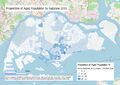 Proportion of Aged Population by Subzone 2010.jpg 3,507 × 2,480; 857 KB
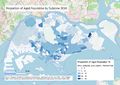
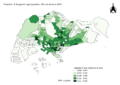
 Proportion of Aged Population by Subzone 2018.jpg 3,507 × 2,480; 865 KB
 Proportion of Aged Population in 2010.png 3,507 × 2,188; 747 KB
 Proportion of Aged Population in 2010 JeromeQuah.png 1,169 × 826; 287 KB
 Proportion of Aged Population in 2018.png 3,507 × 2,080; 721 KB
 Proportion of Aged Population in 2018 JeromeQuah.png 1,169 × 826; 285 KB
 Proportion of Aged Population in Each Subzone for 2010.jpg 3,507 × 2,480; 813 KB
 Proportion of Aged Population in Each Subzone for 2018.jpg 3,507 × 2,480; 818 KB
 Proportion of Aged Populations 2018.png 3,507 × 2,480; 943 KB
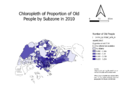
 Proportion of Population Aged 65 and Above by Subzone (2010).png 1,681 × 1,189; 1.56 MB
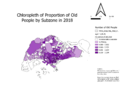
 Proportion of Population Aged 65 and Above by Subzone (2018).png 1,681 × 1,189; 1.48 MB
 Proportion of Singapore's aged population(65 and above) in 2010.png 3,507 × 2,480; 968 KB
 Proportion of Singapore's aged population(65 and above) in 2018.png 3,507 × 2,480; 961 KB
 Proportion of aged population 2010.png 1,056 × 687; 183 KB
 Proportion of aged population 2018.png 1,013 × 698; 168 KB
 Proportional2010.png 3,507 × 2,480; 1.03 MB
 Proportional2018.png 3,507 × 2,480; 1.04 MB
 ProportionalAged Ppln 2010.png 1,412 × 941; 228 KB
 Proportional 2010.png 1,169 × 826; 221 KB
 Proportional 2010 sheryee.png 1,169 × 826; 221 KB
 Proportional 2018.png 1,169 × 826; 224 KB
 Proportional 2018 sheryee.png 1,169 × 826; 224 KB
 Proportional AgedPopulation2010 MapImage.png 3,507 × 2,480; 1.41 MB
 Proportional AgedPopulation2018 MapImage.png 3,507 × 2,480; 1.43 MB
 Proportional Of Aged Population In 2010.png 3,507 × 2,480; 945 KB
 Proportional Of Aged Population In 2018.png 3,507 × 2,480; 932 KB
 Proportional of Aged Population in 2010.png 3,507 × 2,480; 894 KB
 Proportional of Aged Population in 2018.png 3,507 × 2,480; 818 KB
 Proportional of Aged Population to Total Residents in 2010.png 1,437 × 823; 805 KB
 Proportional of Aged Population to Total Residents in 2010 New.png 1,457 × 836; 845 KB
 Proportional of Aged Population to Total Residents in 2018.png 1,438 × 820; 782 KB
 Proportional of Aged Population to Total Residents in 2018 New.png 1,437 × 823; 779 KB
 Proportional of aged population (+65) in 2010.png 3,507 × 2,480; 962 KB
 Proportional of aged population (2010).png 3,507 × 2,480; 802 KB
 Proportional of aged population (2010) (1).png 3,507 × 2,480; 802 KB
 Proportional of aged population (2018).png 3,507 × 2,480; 788 KB
 Proportional of aged population (2018) (1).png 3,507 × 2,480; 788 KB
 Proportional of aged population in 2010.png 3,507 × 2,480; 544 KB
 Proportional of aged population in 2018.png 3,507 × 2,480; 600 KB
 Proportionaleighteenfinal.jpg 2,338 × 1,653; 253 KB
 Proportionalten.jpg 2,338 × 1,653; 255 KB
 Proposal.png 2,480 × 520; 1.44 MB
 Proposal Banner.jpg 1,280 × 534; 111 KB
 Propotion of Aged Population 2010.png 3,507 × 2,480; 1.04 MB
 Propotionelderly2010 kch.png 3,507 × 2,480; 800 KB
 Propotionelderly2018 kch.png 3,507 × 2,480; 822 KB
 Proprotion 2010.jpeg 3,507 × 2,480; 390 KB
 Prox.jpeg 3,507 × 2,480; 517 KB
 Prox22.jpeg 3,507 × 2,480; 544 KB


.png)
.png)
_in_2010.png)
_in_2018.png)


_in_2010.png)
.png)
_(1).png)
.png)
_(1).png)


