Uncategorised files
Jump to navigation
Jump to search
Showing below up to 50 results in range #1,851 to #1,900.
View (previous 50 | next 50) (20 | 50 | 100 | 250 | 500)
 Percentage Change formula.png 322 × 133; 5 KB
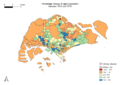
 Percentage Change in Aged Population.png 3,507 × 2,480; 961 KB
 Percentage Change in Aged Population between 2010 and 2018.png 3,507 × 2,480; 1.35 MB
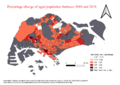
 Percentage Change of Aged Population (2010 and 2018).png 3,507 × 2,480; 1.11 MB
 Percentage Change of Aged Population Between 2010 and 2018.jpg 1,169 × 826; 113 KB
 Percentage Change of Aged Population Singapore 2010 2018.png 3,507 × 2,480; 1.29 MB
 Percentage Change of Aged Population between 2010 and 2018.png 3,547 × 2,069; 708 KB
 Percentage Change of Aged Population between 2010 and 2018 JeromeQuah.png 1,169 × 826; 280 KB
 Percentage Change of Aged Population btw 2010 and 2018.png 1,108 × 681; 113 KB
 Percentage Change of Aged Population from 2010 to 2018.png 1,681 × 1,189; 1.6 MB
 Percentage Change of Aged Population in Each Subzone between 2010 and 2018.jpg 3,507 × 2,480; 816 KB
 Percentage Change of Aged Population in Singapore From 2010 to 2018.png 3,507 × 2,480; 1.06 MB
 Percentage change 2010-2018.png 1,076 × 725; 196 KB
 Percentage change 2010 -2018.png 1,273 × 826; 719 KB
 Percentage change legend.png 3,507 × 2,480; 1.12 MB
 Percentage change of Aged Population between 2010 and 2018.png 3,507 × 2,480; 915 KB
 Percentage change of aged population between 2010-2018 (1).png 3,507 × 2,480; 971 KB
 Percentage change of aged population between 2010 and 2018(NXJ).png 3,507 × 2,480; 611 KB
 Percentage change of aged population between 2010 and 2018.png 3,507 × 2,480; 955 KB
 Percentage change twy.png 3,507 × 2,480; 899 KB
 Percentage chng.png 3,507 × 2,480; 895 KB
 Percentage distribution.png 1,087 × 351; 5 KB
 Percentage ex01.png 3,507 × 2,480; 1,016 KB
 Percentage of Total.png 939 × 643; 190 KB
 Percentage sheryee.png 1,169 × 826; 229 KB
 Percentagechange.jpg 2,806 × 1,984; 1.97 MB
 Personalpage.jpg 461 × 74; 6 KB
 Photo.jpg 281 × 40; 4 KB
 Photo6334574753393781277.jpg 1,280 × 905; 352 KB
 Photo6334574753393781278.jpg 1,280 × 905; 303 KB
 Photo6334574753393781279.jpg 1,280 × 905; 350 KB
 Photo6336833554004158821.jpg 1,280 × 905; 257 KB
 Photo6336833554004158824.jpg 1,280 × 905; 227 KB
 Photo 2019-09-15 21-26-54.jpg 1,115 × 723; 135 KB
 Picture1.jpg 1,920 × 1,080; 200 KB
 Picture2.jpg 1,920 × 1,080; 129 KB
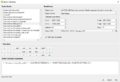
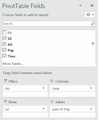 PivotTable.png 519 × 635; 14 KB
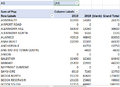 PivotTable Output (Jim).png 811 × 590; 31 KB
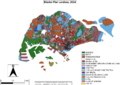 Planned Landuse, 2014, compressed.png 3,507 × 2,480; 661 KB
 Playground.png 512 × 512; 29 KB
 Pln area 08 punggol.jpg 339 × 249; 9 KB
 Pln area 14 punggol.jpg 339 × 253; 9 KB
 PlotInfo 2.png 475 × 563; 23 KB
 Plot Info.png 479 × 559; 23 KB
 Plotinfo5.png 479 × 563; 23 KB
 Poly buffer.png 1,600 × 1,131; 464 KB
 Poly ratio.png 428 × 304; 15 KB
 Polygon land.jpg 3,507 × 2,480; 1.09 MB
 Polygonized.png 823 × 755; 558 KB
 Pop1.png 2,500 × 506; 421 KB


.png)


.png)
.png)


.png)


