Uncategorised files
Jump to navigation
Jump to search
Showing below up to 50 results in range #1,811 to #1,860.
View (previous 50 | next 50) (20 | 50 | 100 | 250 | 500)
 Part 5.6-ljr.png 1,609 × 739; 1.03 MB
 Part 55555.jpg 2,501 × 1,232; 373 KB
 Part 5 (Suitability).png 968 × 988; 236 KB
 Part 6666666666.jpg 2,456 × 1,237; 396 KB
 Part 77777777777.png 2,545 × 1,424; 781 KB
 Part 88888.jpg 2,078 × 1,304; 380 KB
 Part One - Map Views w Roads, Buildings, Natural Areas and Elevation.png 3,507 × 2,480; 745 KB
 Part Three - Criterion Scores for various Layers.png 3,507 × 2,480; 1.1 MB
 Part Two Proximity Raster w Roads, Buildings, Natural Areas and Slope Raster layer.png 3,507 × 2,480; 1.12 MB
 Part of map1 twy.jpg 1,274 × 785; 72 KB
 Partc.jpg 781 × 550; 58 KB
 PengSiang2008.png 492 × 378; 87 KB
 PengSiang2014.png 360 × 281; 58 KB
 PerChnge.jpg 3,507 × 2,480; 475 KB
 Perc Change Map.png 3,507 × 2,480; 870 KB
 Percen.png 1,000 × 707; 162 KB
 Percent.png 3,507 × 2,480; 1.06 MB
 PercentChange2010 2018.jpg 3,507 × 2,480; 1.81 MB
 Percent Christine.png 600 × 379; 164 KB
 Percent change.jpg 3,507 × 2,480; 498 KB
 Percentage-change.jpg 3,507 × 2,480; 255 KB
 Percentage.jpeg 1,000 × 707; 65 KB
 Percentage2010.png 3,507 × 2,480; 1,010 KB
 Percentage2018.png 3,507 × 2,480; 1,020 KB
 PercentageChange.png 1,267 × 738; 268 KB
 PercentageChange2010-18.png 3,507 × 2,480; 1.07 MB
 PercentageChange2010to2018.png 3,507 × 2,480; 1.03 MB
 PercentageChangeBetween2010and2018.png 3,507 × 2,480; 667 KB
 PercentageChange .png 3,507 × 2,480; 1.19 MB
 PercentageChange 2010to2018.png 3,507 × 2,480; 920 KB
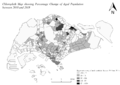
 PercentageChange AgedPopulation between2010and2018 MapImage.png 3,507 × 2,480; 1.43 MB
 PercentageChange confirmed.jpg 3,507 × 2,480; 575 KB
 PercentageChg2010-2018.png 3,507 × 2,480; 1.36 MB
 Percentage .png 1,169 × 826; 229 KB
 Percentage 01.png 3,507 × 2,480; 1.08 MB
 Percentage 2.png 3,507 × 2,480; 1.07 MB
 Percentage Change, comparison between 2010 and 2018.png 3,507 × 2,480; 218 KB
 Percentage Change From 2010 and 2018.jpg 3,507 × 2,480; 473 KB
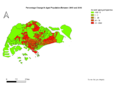
 Percentage Change In Aged Population 2010-2018.jpg 3,507 × 2,480; 811 KB
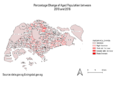
 Percentage Change Of Aged Population Between 2010 And 2018.png 3,507 × 2,480; 967 KB
 Percentage Change formula.png 322 × 133; 5 KB
 Percentage Change in Aged Population.png 3,507 × 2,480; 961 KB
 Percentage Change in Aged Population between 2010 and 2018.png 3,507 × 2,480; 1.35 MB
 Percentage Change of Aged Population (2010 and 2018).png 3,507 × 2,480; 1.11 MB
 Percentage Change of Aged Population Between 2010 and 2018.jpg 1,169 × 826; 113 KB
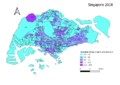
 Percentage Change of Aged Population Singapore 2010 2018.png 3,507 × 2,480; 1.29 MB
 Percentage Change of Aged Population between 2010 and 2018.png 3,547 × 2,069; 708 KB
 Percentage Change of Aged Population between 2010 and 2018 JeromeQuah.png 1,169 × 826; 280 KB
 Percentage Change of Aged Population btw 2010 and 2018.png 1,108 × 681; 113 KB
 Percentage Change of Aged Population from 2010 to 2018.png 1,681 × 1,189; 1.6 MB


.png)


.png)


