SMT201 AY2019-20T1 EX2 Lee Jayin
Gombak Area Overview
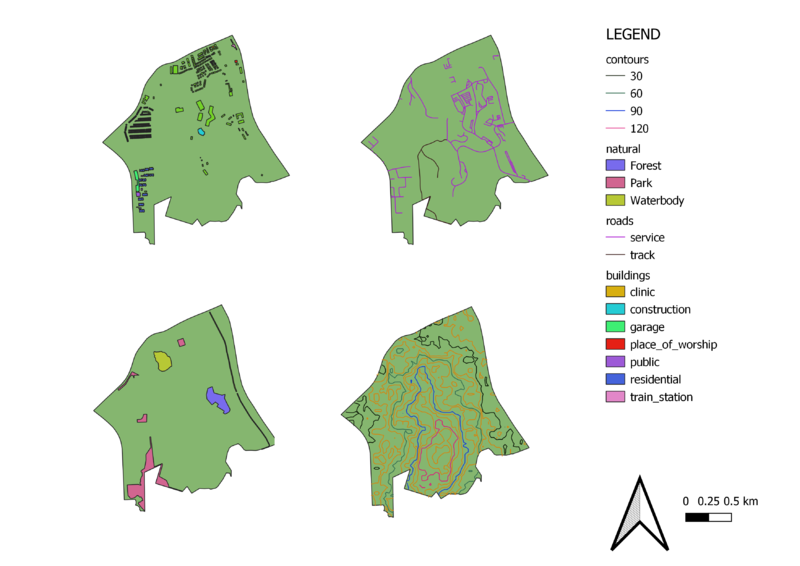
Study area and the Target Roads (Top left map)
In accordance with the Accessibility factor, it is preferred for the Communicable Disease Quarantine Centre (CDQC) to be located around local roads – mainly service roads and tracks. This is to ensure easy transportation of building materials during the construction stage. Based on the map layout, there is a heavier cluster of local roads on the North-East side making it a preferable location to build the CDQC in terms of accessibility.
Study area and Buildings (Top right map)
In accordance with the Health risk factor, it is preferred for the Communicable Disease Quarantine Centre (CDQC) to be located away from population - housing areas and offices. This is to avoid disease spreading to the nearby population. Based on the map layout, there are buildings clustered mainly on all borders of Gombak except for the south and south-east border. The central area is also largely free from buildings. This makes these few areas, away from buildings/infrastructure, away from the population, to be more preferable areas to build the CDQC.
Study area and the Target Natural Features (Bottom left map)
In accordance with the Natural conservation factor, it is preferred for the CDQC to be located away from forested land, park and water. This is to 1) prevent the transmitting of diseases through these areas and 2) reduce cases of incidents where these natural areas end up being infected and may have to be cleared off totally. Based on the map layout, there are parks located on the North, North-West and South-West areas, a water body towards the North-West area and a forest at the East. This leaves the South and South-East area a preferable place to build the CDQC.
Study area and Digital Elevation (Bottom right map)
In accordance with the Economic factor, it is preferred for the CDQC to avoid areas with steep slope. This is to keep development cost low as steep slopes incur higher costs. Based on the map layout, Gombak area gets progressively steep from the North area to the Central and South area. This might explain why there is a lack of buildings and infrastructure at the South area since it will be more expensive to develop there. However, it is for the same reason, the south area being situated away from buildings and population that makes it a suitable location to build the CDQC.
Proximity
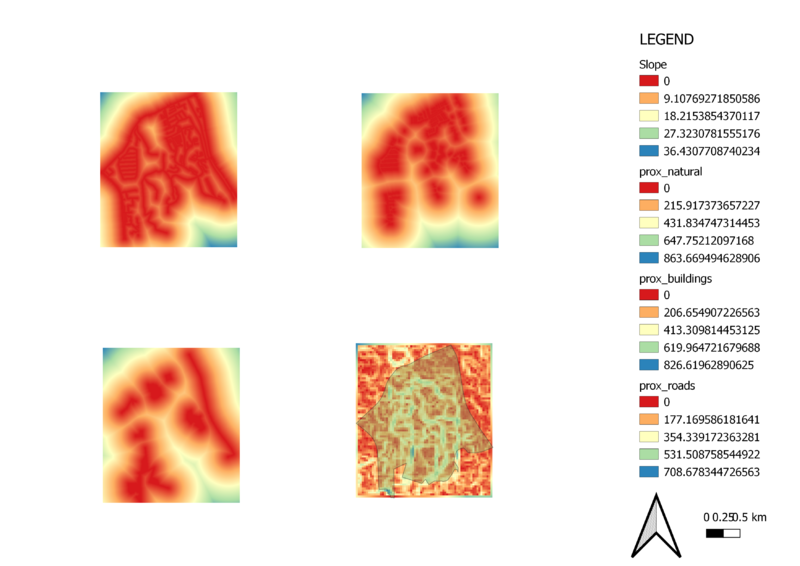
Study area and Proximity to Target Roads layer (Top left map)
In terms of proximity, the furthest distance from the roads is 708.678 meters, and shown to be the blue areas. In view of Accessibility, we want as close proximity to the roads as possible. Thus, we look at the red, orange and yellow areas which show the proximity between 0-354 meters. These areas being closer to the roads, are more suitable to build the CDQC.
Study area and Proximity to Buildings layer (Top right map)
In terms of proximity, the furthest distance from the buildings is 826.62 meters, and shown to be the blue areas. In view of Health risk, we want to be as far away from the buildings as possible. The blue areas though most suitable, are out of the Gombak layer perimeter. Thus, we look at the next best option which is the yellow and green areas showing the proximity between 413-619 meters.
Study area and Proximity to Target Natural Features layer (Bottom left map)
In terms of proximity, the furthest distance from the natural features is 863.66 meters. In view of Natural conservation, we want to be as far away from natural features as possible. The blue areas though most suitable, are out of the Gombak layer perimeter. Thus, we look at the next best option which is the yellow and green areas showing the proximity between 431-647 meters.
Study area and Slope layer (Bottom right map)
The legend of Slope layer shows that the minimum and maximum values of the slope values are 0 (red) and 36.4308 (blue) degrees respectively. The grids with red areas indicate locations with relatively gentle slope. On the other hand, the blue areas indicate locations with steeper slope. In view of the economic factor, we look to build the CDQC at areas with less steep slopes. The map layout shows the degree of slope increases as we progress from North to South of the map. Thus, it is best economically to not build the CDQC at the South.
Criterion Scores
To come up with a standardized Criterion Score, the scale used across all 4 maps has to be uniformed. Thus, raster pixel value has for certain factors (in this case slope and road) have to be inverted to be considered equally with the natural features and buildings factors.
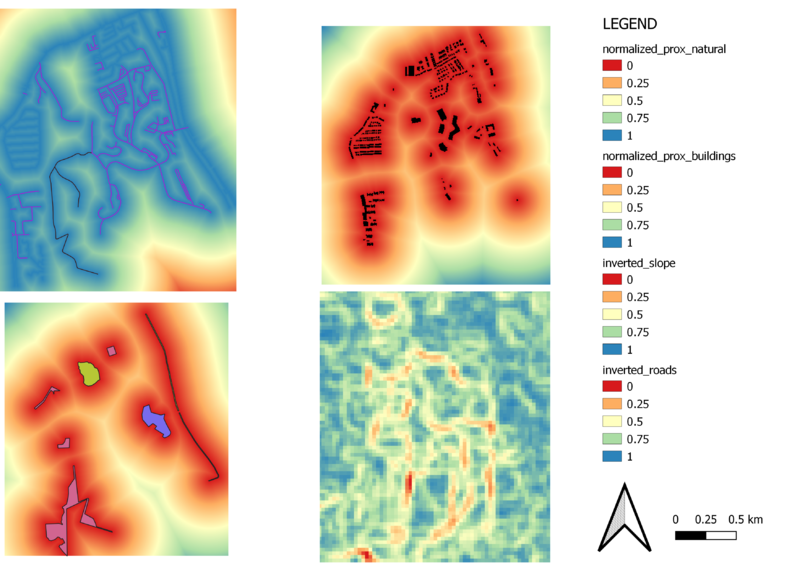
All four proximity layers of the respective factors are first normalized with the Raster calculator using the Minimum-Maximum formula. Slope and road layers are then inverted in the Raster calculator using the formula: (1 − Normalized Proximity Map of Roads). Band rendering is then applied, providing the Criterion Score Scale of 0 to 1 for all four layers.
Accessibility Factor (Roads)
At the top left, the inverted_roads layer shows the suitable site for the building of the CDQC in terms of the Accessibility factor. The blue and green areas are of closer proximity to the roads, and the red areas to be much further away. Gombak is mainly filled with blue and green areas, thus it is easier to find a suitable site with accessibility to build the CDQC.
Health Risk Factor (Building)
At the top right, the normalized_prox_buildings layer shows the suitable site for the building of the CDQC in terms of the Health risk factor. The red areas are unfavourable locations and the green areas as favourable. In Gombak, the green areas are mainly situated at the bottom area, away from most of the buildings clustered at the North and West area, making it a more suitable place to build the CDQC.
Natural Conservation Factor (Natural Features)
At the bottom left, the normalized_prox_natural layer shows the suitable site for the building of the CDQC in terms of the Natural Conservation factor. The red areas are unfavourable locations and the green areas as favourable. In Gombak, only the South and South-east area are further away from the red areas and are yellow-green.
Economic Factor (Slope)
At the bottom right, the inverted_slope layer shows the suitable site for the building of the CDQC in terms of the Economic factor. The red areas indicate steeper slopes (high terrains) while the blue area has gentler slopes, making it more economically wise to build the CDQC there.


