SMT201 AY2018-19T1 EX2 Ho Xin Yi
Contents
Land Sustability Study For National Communicable Disease Quarantine Centre
To identify a location suitable for building a national Communicable Disease Quarantine Centre, it must meet the four decision factors:
1) Economic factor: The selected site should avoid steep slope. This is because construction at steep slope tends to involve a lot of cut-and-fill and will lend to relatively higher development cost.
2) Accessibility factor: The selected site should be close to existing local roads, namely: service roads and tracks. This is to ensure easy transportation of building materials during the construction stage.
3) Health risk factor: The selected site should be away from population i.e. housing areas and offices in order to avoid disease spreading to the nearby population.
4) Natural conservation factor: The selected site should be away from forested land, park and water.
Overview of Gombak: Roads, Buildings, Natural Features and Digital Elevation:
xxxxxxxxxxxxxxxx
Part 2: Choropleth Mapping
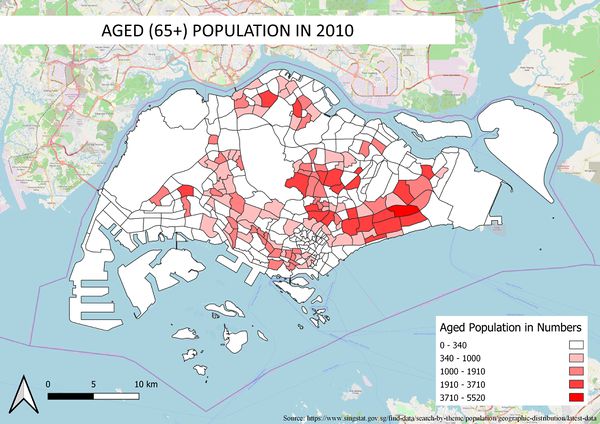
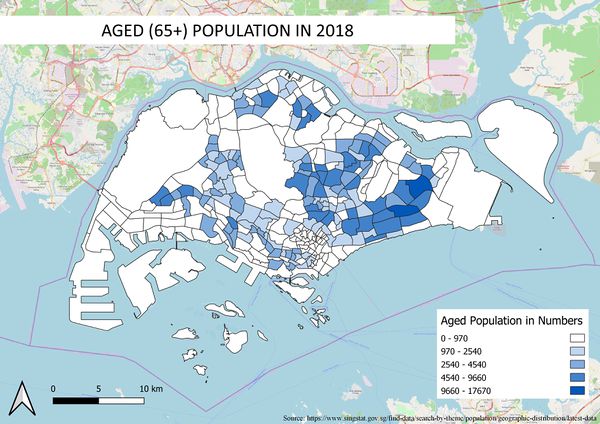
Aged population (+65) in 2010 and 2018
For both the year 2010 and 2018 aged population map: By relational joining the data on the population as well as the subzone map using the field "SUBZONE_N", I manage to merge both field list together. Afterward, I created a new field '65+' to filter out the population with age 65 years and above for each subzone using field calculator. Under symbology -> gradual, I chose to natural break(jerks) the data instead of equal breaking them so as to ensure that the histogram won't be too skewed. One problem that I actually occur in this part that is I realize my field name isn't in 'integer'. So by going to processing and with the help of toolbox, I manage to change the field type into an integer.
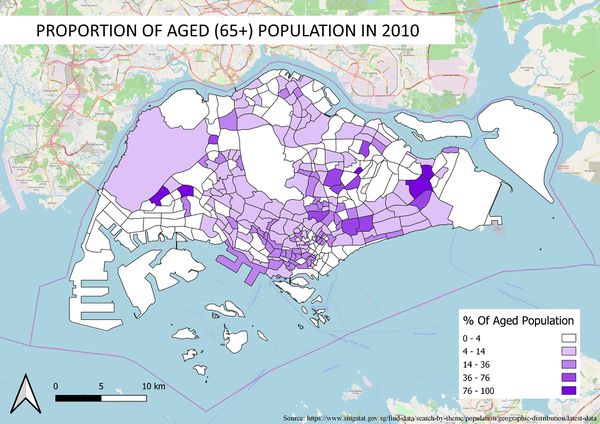
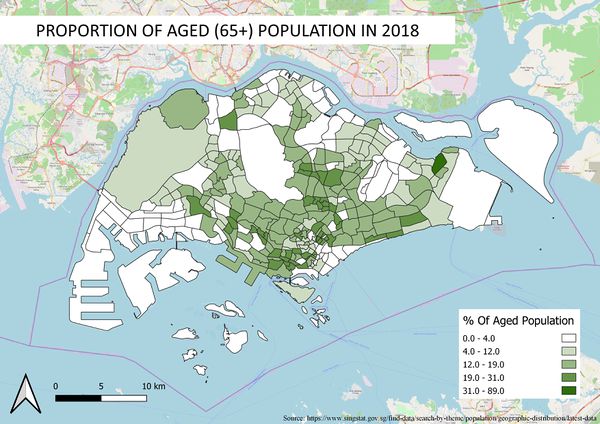
Proportional of aged population in 2010 and 2018
Same method for both proportional of aged population in 2010 and 2018 map: I used relational joining again, to join the field list of the 2010 and 2018 aged population using the field 'SUBZONE_N'. With the formula 'NumberOfAgedPopu/ TotalPopulation * 100", i manage to find the proportion of the aged population. With that, I use the same steps as I did for the aged population map in creating the symbology for the map.
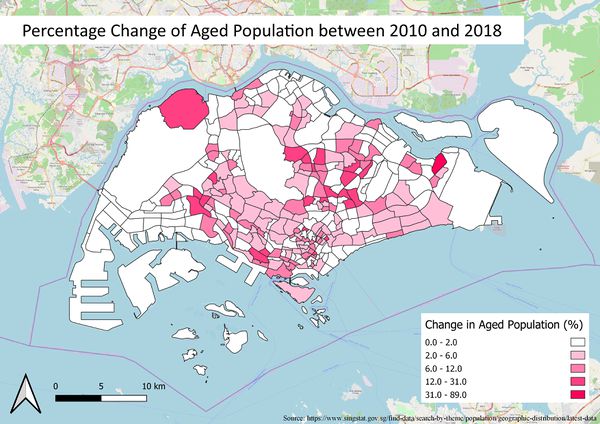
Percentage change of aged population between 2010 and 2018
Initially to calculate the percentage change of the aged population between 2010 and 2018, I wanted to do it by recalculating the proportion of each year by changing the formula 'NumberOfAgedPopu/ TotalPopulation * 100" to 'NumberOfAgedPopu/ (TotalPopulationOfBothYear/2) * 100', but I conclude that it will not give the right proportion as the population of both years is not the same and hence, might lead to unreliable proportion for both years. So, I took the proportion (%) I calculated in both 2010 and 2018 and subtracting them from each other to find the differences. In order to prevent negative value for appearing in my proportion change, in the attribute tables, I selected the year which the % is higher to subtract the year which the % is lower using field calculator.

