SMT201 AY2019-20G1 Ex2 Kang Hui Yun
Contents
Part 1: Base Map Views
Buildings
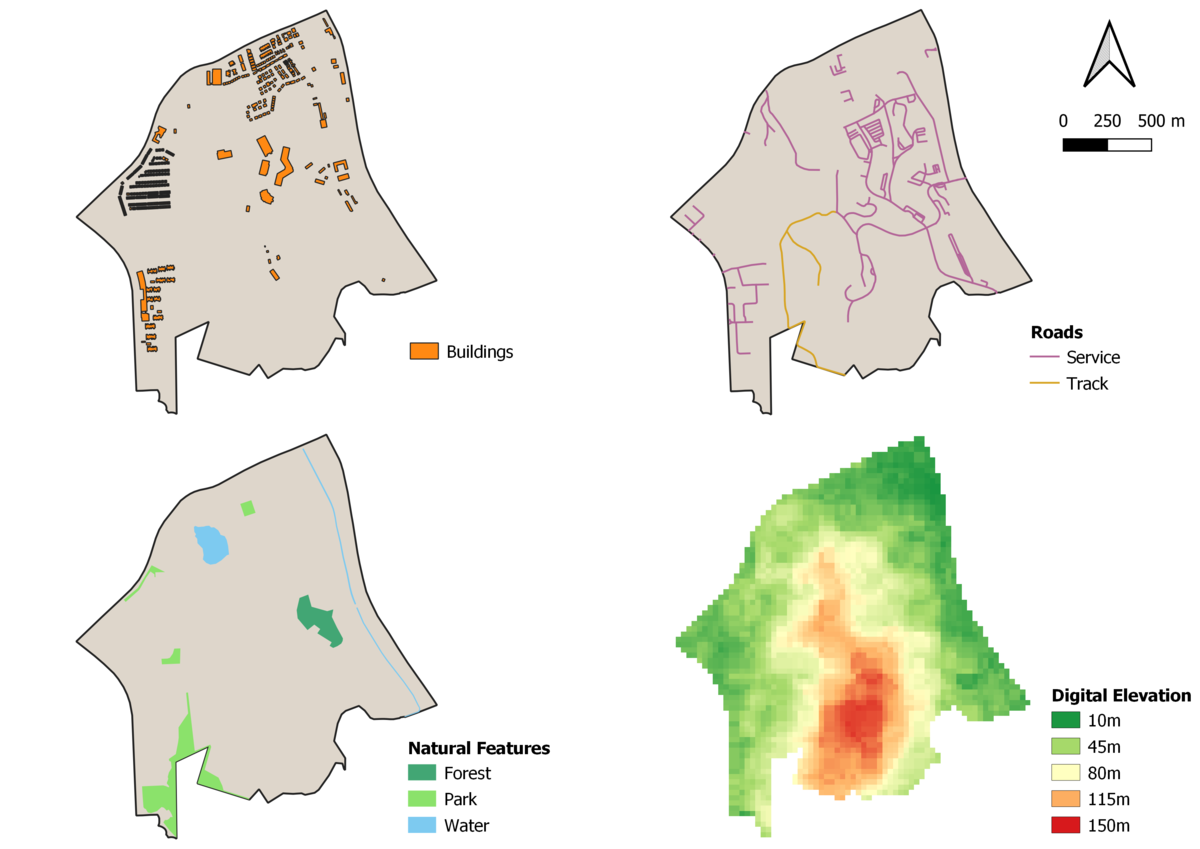
In Gombak, buildings are not evenly distributed—most of them are situated around the boundary of the subzone and exist in the form of clusters. More specifically, there are huge and dense concentration of buildings lying on the north, northwest and southwest area, while the central has fewer but bigger buildings built in a sparser manner. The south and southeast counterparts are rather remote, with only one building seen in southeast.
Roads
After filtering out the service roads and tracks from the rest, it is observed that the network is highly concentrated central east of Gombak, with the rest mostly situated around the boundary. Compared to tracks, service roads are predominant in the area.
Natural Features
Within Gombak there are also several natural features present. The 3 types of features are categorised into different colour representation, intuitively: light blue for waterbodies, light green for parks and dark green for forest. As it will be difficult to tell what both the long and narrow features are, the strokes are removed so that the colours do not get overshadowed. From observation, there are 2 stretches of waterbody near the east perimeter and a forest nearby. There is also another waterbody across north, sandwiched between 2 parks. We can also see 2 other parks located in west and southwest.
Digital Elevation
The map view of the digital elevation has been clipped to only show the Gombak area. This is because it is neater—the map reader will not get much out of the alternative view if the digital elevation of the whole extent is shown with the boundary overlay, as it is hard and/or unlikely for someone to observe the elevation around the boundary itself. The elevation is also intuitively colour-coded with 2 extremes: green and red. Green represents area with gentle slopes, red for steep slopes and anything between will be subdivided into equal intervals with its representative colour.

