SMT201 AY2019-20G2 Ex2 Mabelle Tham Shiqin
hi Mabelle hope u finish this soon :) jiayous
Contents
The Task : Building a National Communicable Disease Quarantine Centre
In this exercise, we are tasked to identify a location suitable for building a National Communicable Disease Quarantine Centre. The selected site must be located at Gombak planning subzone, with a contiguous area of at least 10,000m2 and it must meet the following decision factors:
1. Economic factor: The selected site should avoid steep slope. This is because construction at steep slope tends to involve a lot of cut-and-fill and will lend to relatively higher development cost.
2. Accessibility factor: The selected site should be close to existing local roads, namely: service roads and tracks. This is to ensure easy transportation of building materials during the construction stage.
3. Health risk factor: The selected site should be away from population i.e. housing areas and offices in order to avoid disease spreading to the nearby population.
4. Natural conservation factor: The selected site should be away from forested land, park and water.
Overview
A map layout with four views showing:
the study area and the target roads, the study area and buildings, the study area and the target natural features, the study area and digital elevation, and
Figure 1: Understanding our Study Area, Bukit Gombak
Accessibility Factor - Roads
As seen in the figure, the target roads are of different thickness to replicate reality where the tracks are wider and thus are represented bu thicker grey line vectors. A higher concentration of 199 service roads are observed at the north-east section of Gombak. Whereas there are only 2 tracks located towards the south-west portion of Gombak. The selected land lot should preferably be close and easily accessible to local roads, particularly service road and tracks to ensure smooth construction of the National Communicable Disease Quarantine Centre.
Health Risk Factor - Buildings
Data provided by OpenStreetMap included 7 types of buildings namely clinic, construction site, garage, place of worship, public space, residential area and train station. However 505/527 building 'types' were unknown. After cleaning the data by referring to data available on google, the buildings are then categorised by their type. From the map, we notice that residential buildings are the most common building type in Gombak. It should be noted that the selected site should be situated away from population i.e. housing areas and offices in order to avoid disease spreading to the nearby population.
Natural Conservation Factor - Natural Features
From Figure 1, forested land takes up about 35km2 in the eastern region of Gombak, parks are generally located towards the southwest region of Gombak and totals up to 88.2km2 and waterstream in the eastern region of Gombak takes up about 12.7km2. It should be noted that the selected site should be away from forested land, park and water.
Economic Factor - Digital Elevation
From the Elevation legend, we can see that the slope in Gombak varies from 0 to 36.39 degree. Using the ranking model: ranking scores, I classified the slope degree using the following criteria:
<=10 degree most favourable, 10-20 favourable, 20-30 unfavourable, and 30-36.39 as unfavourable. The selected site should avoid steep slope. This is because construction at steep slope tends to involve a lot of cut-and-fill and will lend to relatively higher development cost.
Proximity
A map layout with four views showing: the study area and proximity to target roads layer, the study area and proximity to buildings layer, the study area and proximity to target natural features layer, the study area and slope layer
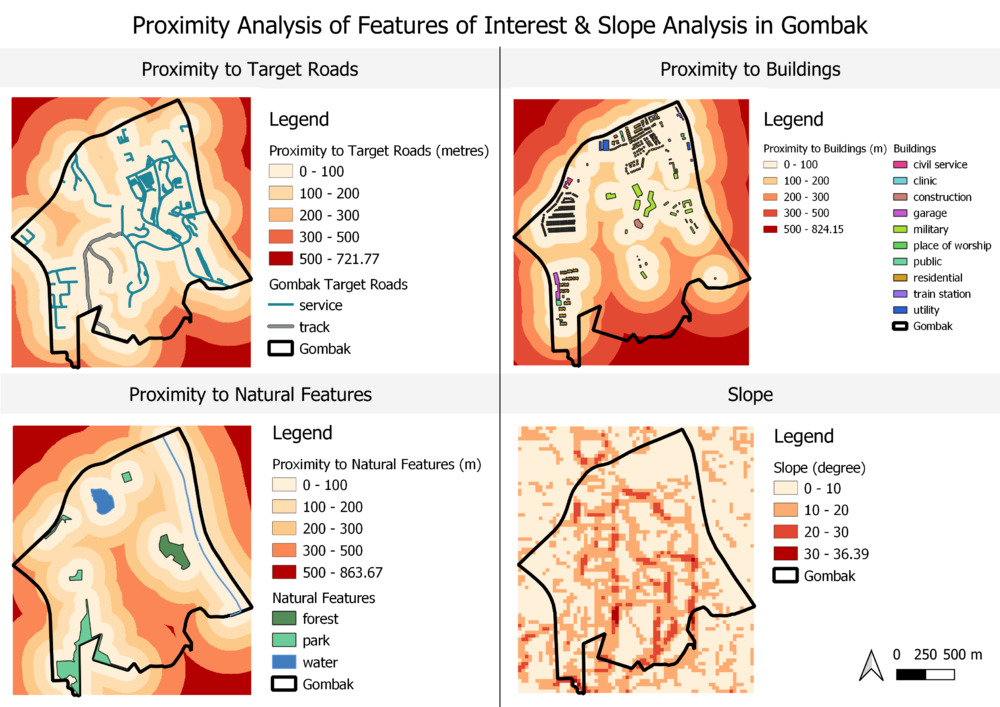
Figure 2: Proximity Analysis on the Four Factors
A proximity analysis on the four factors is conducted to find out how where the most suitable land lot should be located, based on our criterias as mentioned above.
Based on the Ranking Model: Ranking Scores,
I derived binary data for the 4 features by using the following criteria and characterized them as such.
Accessibility Factor (To Target Roads, Buildings and Natural Features):
Sectioning the features by <= 100m, 100-200m, 200-300m, 300-500m and >500 from target roads consisting of service roads and tracks, buildings in Gombak Area mainly made up of residential buildings and military buildings and Natural Features such as Bukit Batok Town Park, Pheonix and Pavillion Park.
As seen from Figure 2, the lighter shades represent closer proximity to the features of interest and a gentler slope.
Proximity to Roads
Since accessibility is one of the determining factors, sites represented by the lighter shades located closer to existing service roads and tracks in the 0-100m or 100-200m ranges are preferred
Proximity to Buildings
As health risk is one of the determining factors, the selected site should be away from population i.e. housing areas and offices in order to avoid disease spreading to the nearby population. These areas are represented by the darker shades of red, preferably in the ranges 300-500m or >=500m.
Proximity to Natural Features
With natural conservation as one of the determining factors, the selected site should be located away from forested land, park and water. This means that areas with darker shades, preferably within the 300-500m and >=500m range are preferred.
Slope Analysis
From the slope legend, we can see that the slope in Gombak varies from 0 to 36.39 degree. Using the ranking model: ranking scores, I classified the slope degree using the following criteria:
<=10 degree most favourable, 10-20 favourable, 20-30 unfavourable, and 30-36.39 as unfavourable. The selected site should avoid steep slope. This is because construction at steep slope tends to involve a lot of cut-and-fill and will lend to relatively higher development cost.
Criterion Scores
To standardize the suitability of each determining factor in building the National Communicable Disease Quarantine Centre, I used the min-max method - one of the 3 criterion standards=ization techniques taught in class.
Figure 3: Min-Max Method, using Criterion Standardization Techniques
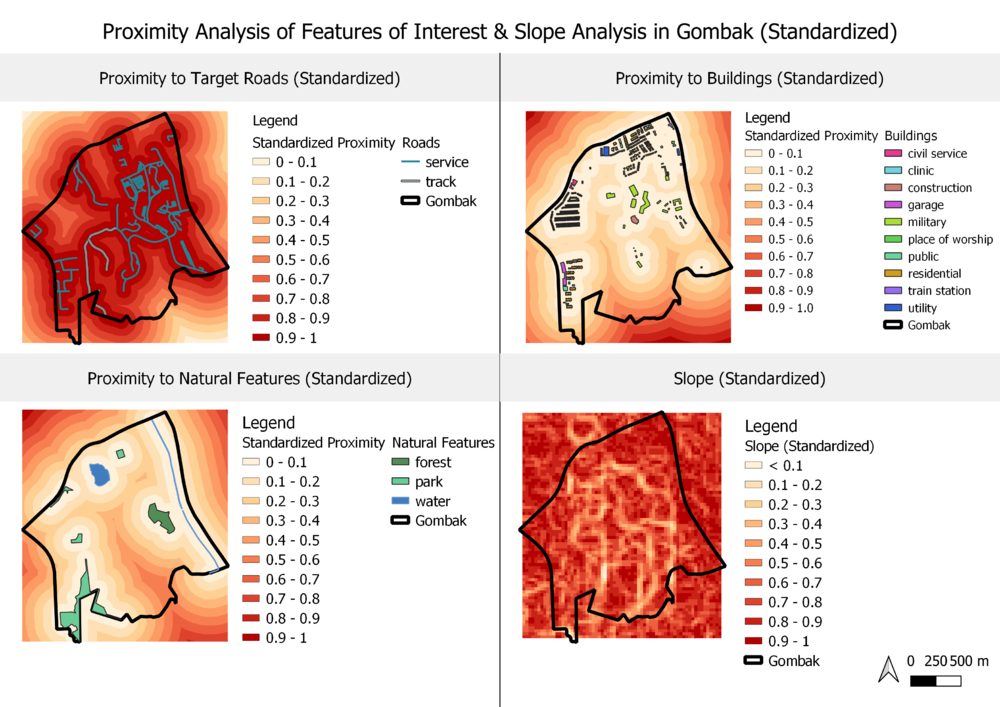
With the standardized results, a more reliable and consistent proximity analysis is conducted.
Figure 4: Standardized Proximity Analysis of Study Area, Bukit Gombak
Accessibility Score
Formula: 1 - (X meters) / 722.50 meters
The standardised score is calculated using 1 - (MinMax) as land lots closer to the roads are preferred and hence should have a higher accessibility score.
Health Risk Score
Formula: (X meters) / 824.98 meters
The standardized proximity to building relates directly to the criterion score for health risk factor. With a lower proximity to buildings, the distance to the building from the Quarantine Centre will be further away which is preferred when building the National Communicable Disease Quarantine Centre as that will result in a lower possibility of disease spreading to the nearby population.
Natural Conservation Score
Formula: (X meters) / 863.67 meters
The standardized proximity to Natural Features relates directly to the criterion score for Natural Conservation factor. With a lower proximity to the natural features, the distance to the neatural features from the Quarantine Centre will be further away which is preferred when building the National Communicable Disease Quarantine Centre as that will result in a higher possibility of conserving the natural features in Gombak, lowering the chances of polluting it.
Economic Score
Formula: 1 - (X deg) / 36.43 deg
The standardised score is calculated using 1 - (MinMax) as land lots with gentler slopes are preferred and hence should have a higher economic score whereas land lots with steeper slopes are less favourable and hence should have a lower economic score as building in areas with a higher slope would result in higher economic costs.
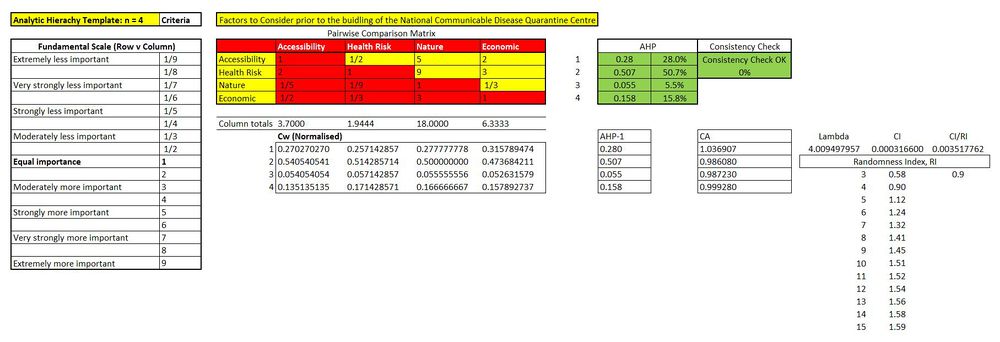
[1]== Analytical Hierarchical Process Input Matrix ==
Figure 5: Using Analytical Hierarchical Process (AHP)
While SAGA (a function in QGIS) provides Analytical Hierarchical Process function, the function does not provide a detailed report. In view of this, we used an Excel-based AHP library such as the AHP Template provided by SCB Associates (AHP Template from SCBUK (XLS)[1]).
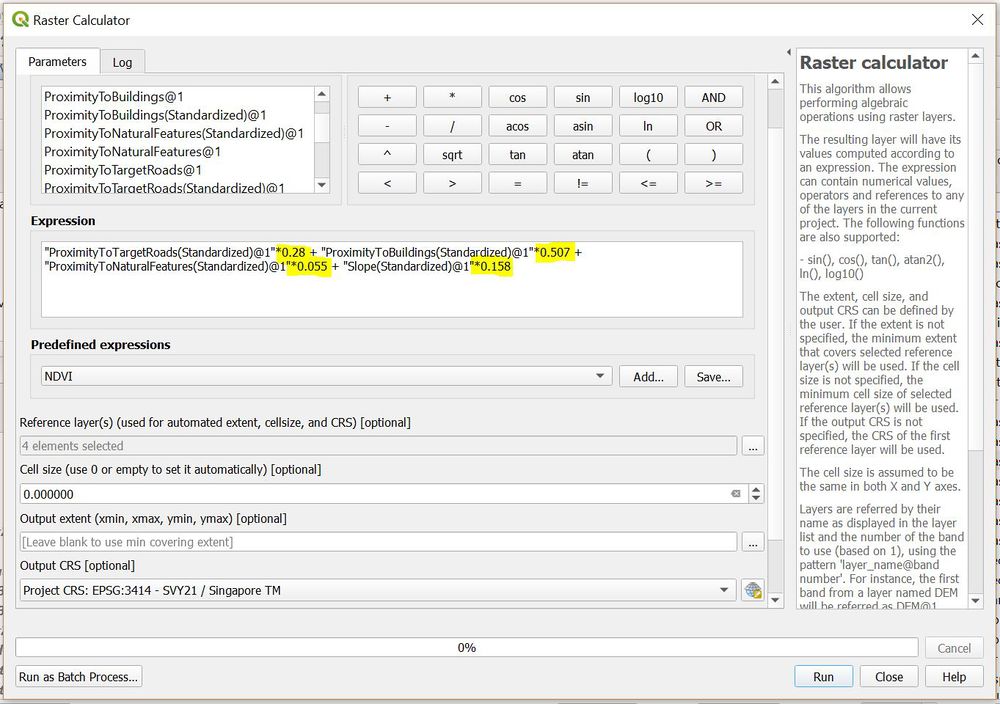
Raster Calculator to Compile Factors based on AHP
Figure 6: Compiling Standardized Factors
Explanation
XXX
XXX
XXX
XXX
XXX
Suitability
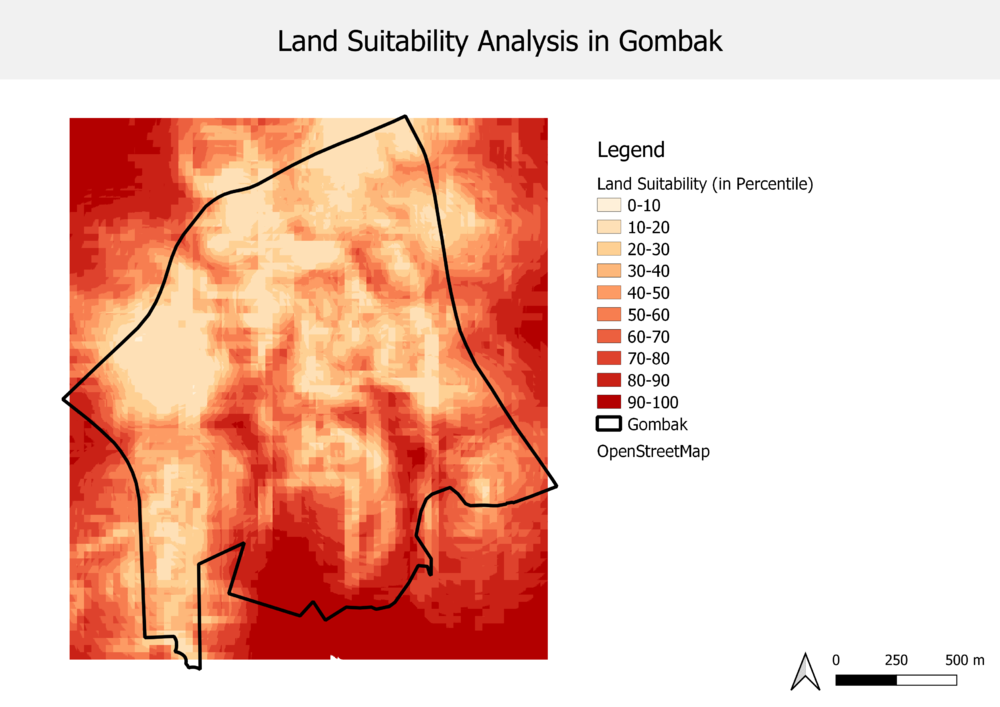
Figure 7: Filtering possible suitable land lots by Percentile
XXX
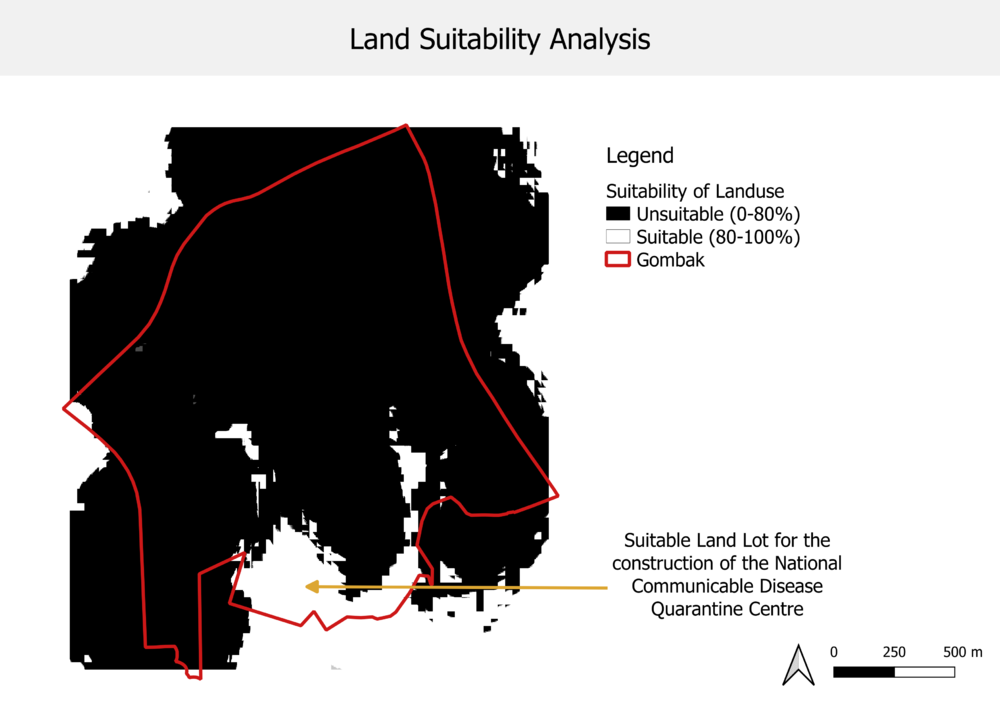
Figure 8: Reclassify (Landlots) by Table
XXX
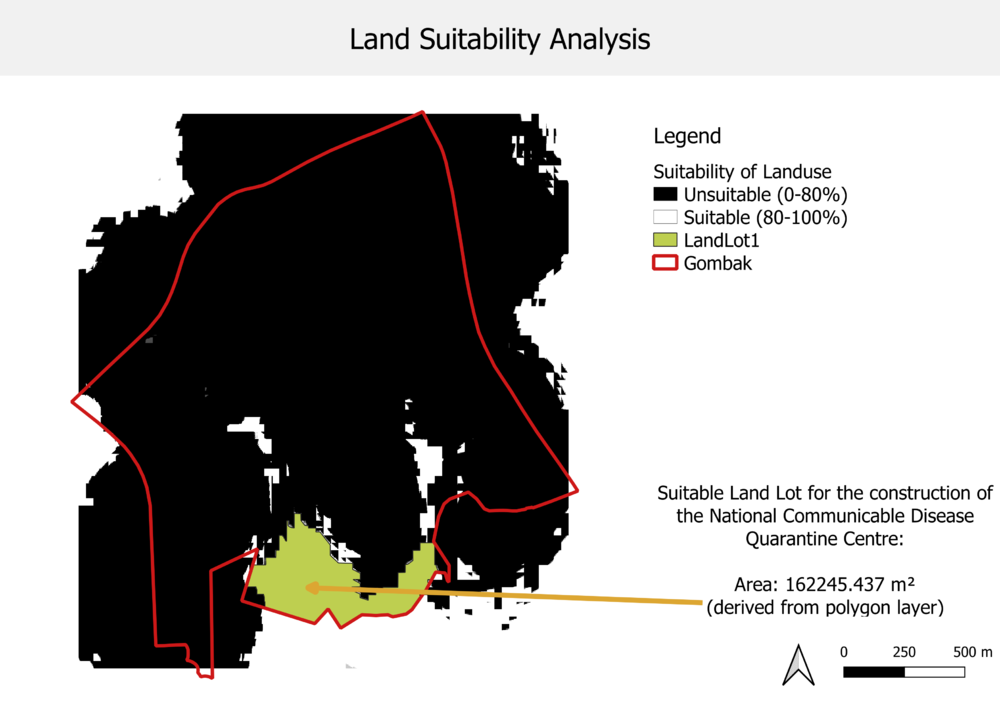
Figure 9: A Map Layout with the Suitability Land Lot(s)
XXX
Conclusion
A mistake of not using the Mask Raster Layer instead of the Extent layer was made. Hence this would have made a large impact, especially with the proximity analysis of the Gombak Area as the extent layer, includes areas out of the delineated subzone 'Gombak' area.
XXX

