SMT201 AY2019-20T1 EX2 Gui yuqi
Contents
- 1 Part One - Map Views w Roads, Buildings, Natural Areas and Elevation
- 2 Part Two Proximity Raster w Roads, Buildings, Natural Areas and Slope Raster layer
- 3 Part Three - Criterion Scores for various Layers
- 4 Part Four - Analytical Hierarchical Process input matrix
- 5 Part Five - Suitability land lots layout
Part One - Map Views w Roads, Buildings, Natural Areas and Elevation
Map with Roads
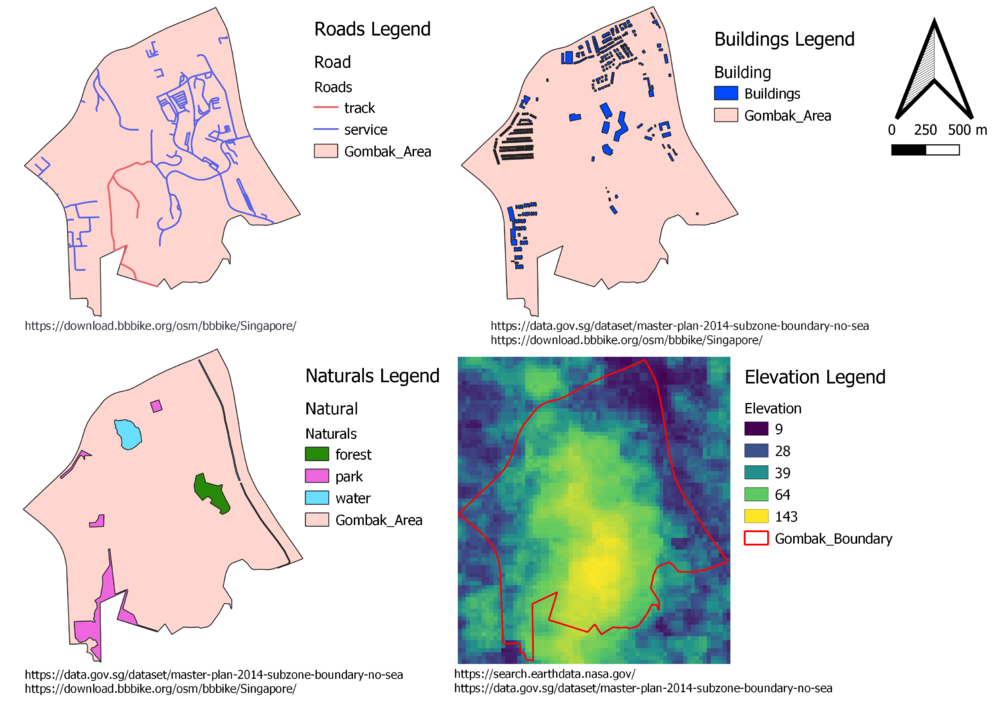
After exracting the Gomback area out, we put the road layer on top. For Road layer, we specificly focus on Servie Roads and Tracks. Since the Disease Quarantine Centre requires a better accessibility factor, so the suitable slot should locate closer to the roads. I used red color to represent track and blue color to represent service roads, so that viewr can better differenciate those two types of roads.
By looking the map view alone, suitable slots should locate at north-east area.
Map with Buildings
I used blue color to represent building areas, as we can see from the map view above, most of the buildings are locate at northern part or sorth-west areas. Since we need to consider the health risk factor, and we need to put the suitable slots far away from populations, in this case, the building areas, thus, based on the building map itself, the suitable slots should be located at southern Gombak area.
Map with Naturals
For the naturals map view, I used different color to represent different type of natural areas. I used green to represent forest, pink for park and baby blue for water. For natural conservation factor, we need to put the suitable slot far away from the natural areas, based on the naturals map alone, the slots should be put around southern Gombak area.
Map with Elevation
As you can see from the Elevation map, I used different color to represent areas with different elevation, yellow areas have higher elevation while the dark areas have lower elevation, green areas have relatively middle elevation.
As you can see, the middle Gombak area is the most elevated, we shoudl consider avoid putting suitable slots here.
Part Two Proximity Raster w Roads, Buildings, Natural Areas and Slope Raster layer
Roads Proximity Map
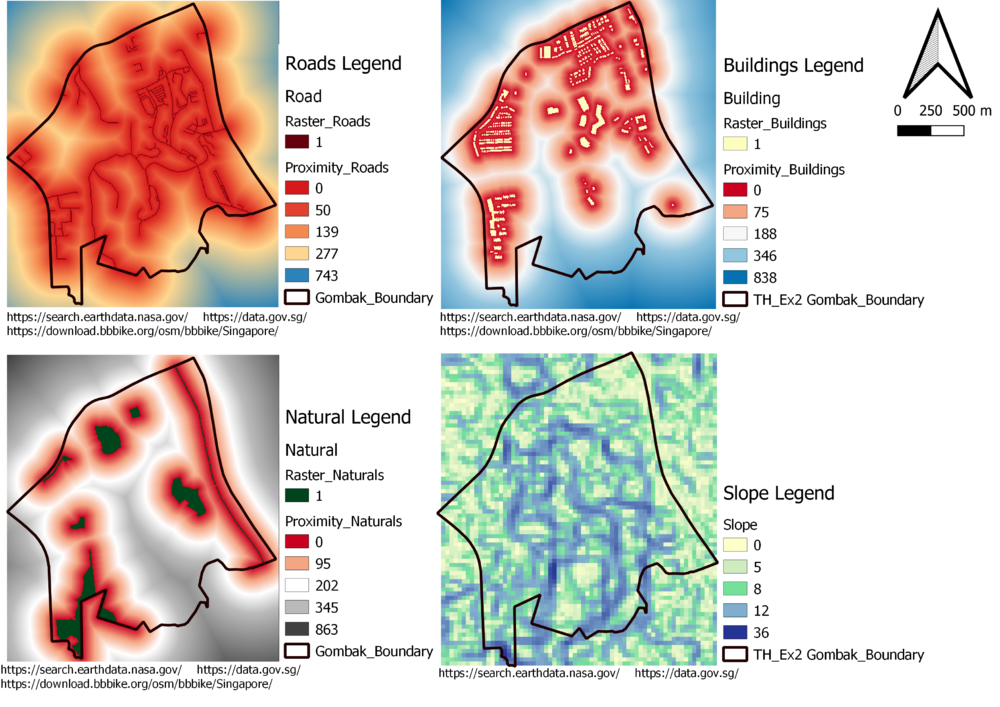
Min = 0 meters, Max = 742.560163330078 meters
As you can see from the Roads proximity map view, I used dark red color to represent the rastered roads. I used red colors to represent those areas who are closer to roads and I used cold color like blue to represent areas who are far from roads, since the Quarantine Centre should be located close to the roads, the red areas could be the potential slots.
Buildings Proximity Map
Min = 0 meters, Max = 837.627415466309 meters
I used redish color to represent areas which close to the buildings to alarm viewers, becasue those are the areas close to population which are the areas we need to avoid when we choose suitable slots. The areas with cold color like blue, are areas far from population and could be the potential suitable slots.
Naturals Proximity Map
Min = 0 meters, Max = 862.805825134277 meters
I use redish color for areas closer to naturals and darker and colder color for areas which far from the naturals
Slope Raster Map
Min = 0 degrees, Max = 36.3826292610168 degrees
I used blue color to represent those areas who has steep slope and yellow color to represent areas which are more flat.
Part Three - Criterion Scores for various Layers
Criterion Score Calculation
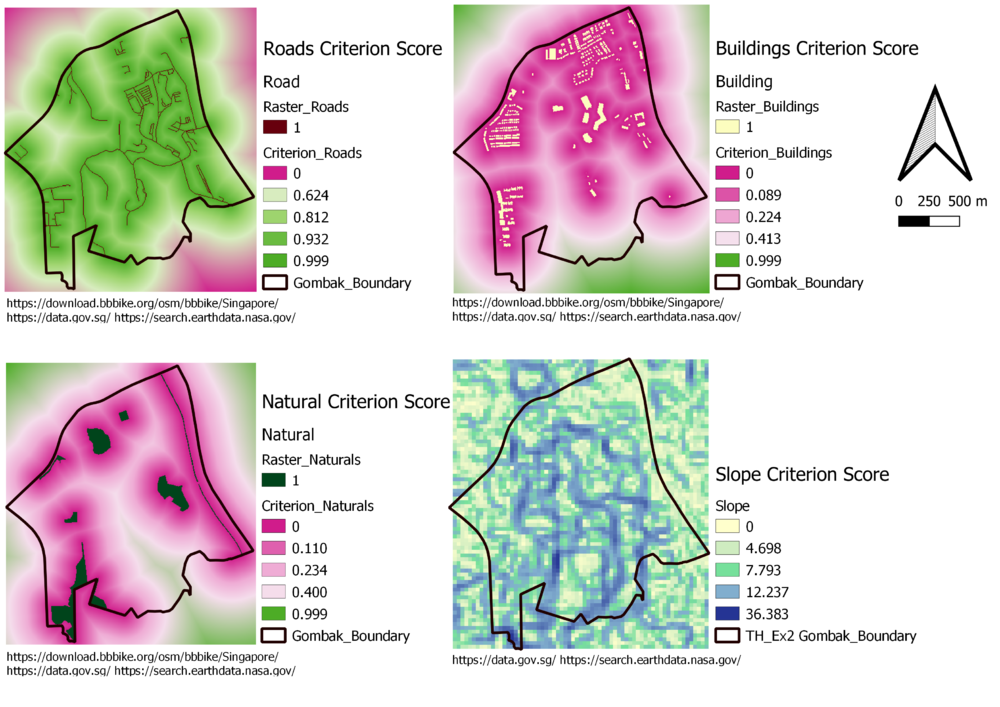
In order to standardise every layer, I used Min-Max Criteria Standardisation Technique.
Formulas:
Roads: 1 - (X - 0 meters ) / 742.560163330078
Slope: 1 - (X - 0 degree ) / 36.3826292610168
The reason why I used 1-(Min-Max Technique) is that for both roads and slope, we need the closer the better and the more flat the better, so those who are closer to roads should have higher score, same as those who are more flat.
BUildings: (X - 0 meters) / 837.627415466309 meters
Naturals: (X - 0 meters) / 862.805825134277 meters
For both buildings and naturals, I just used Min-Max Technique because those areas who are further from building or naturals should have higher score.
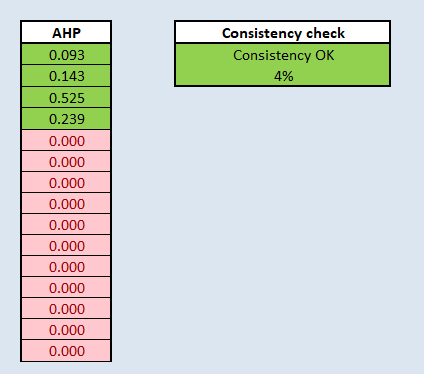
Part Four - Analytical Hierarchical Process input matrix
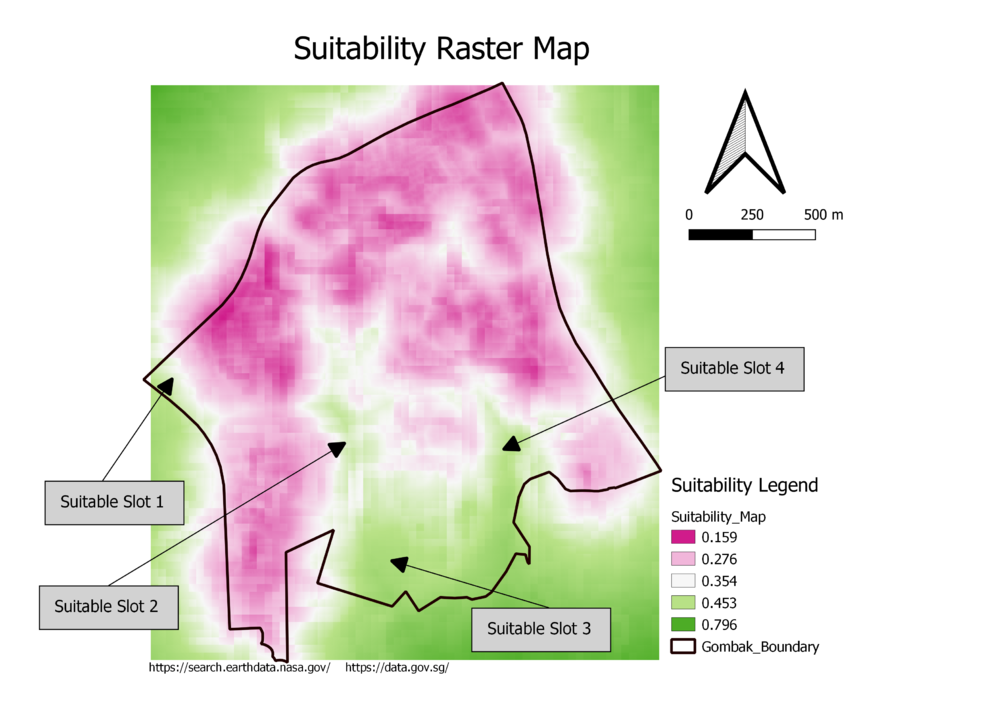
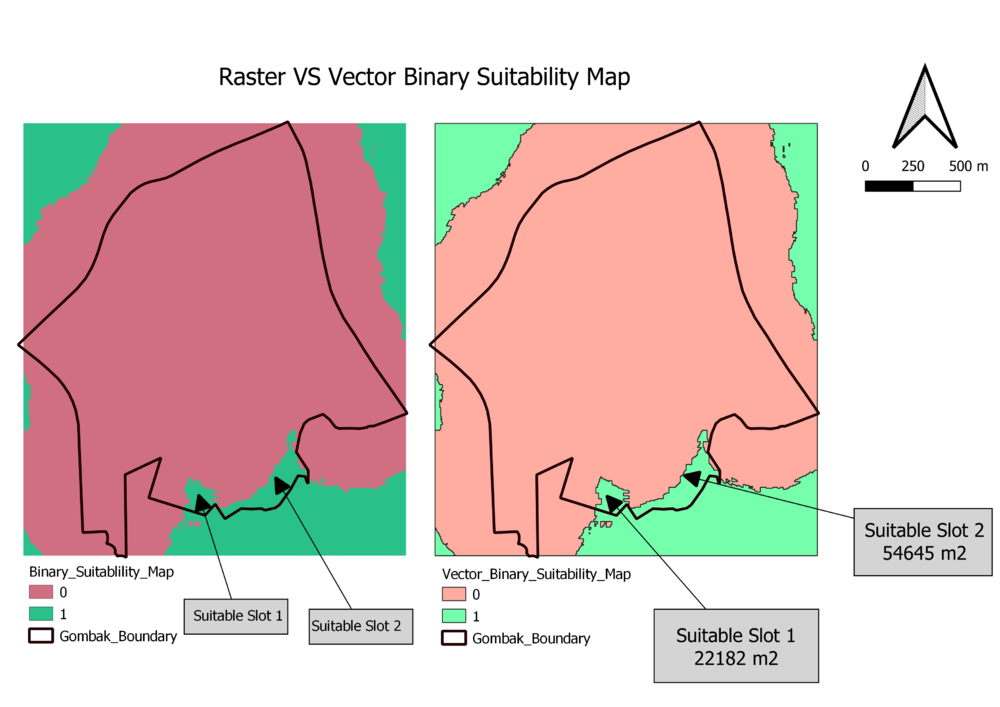
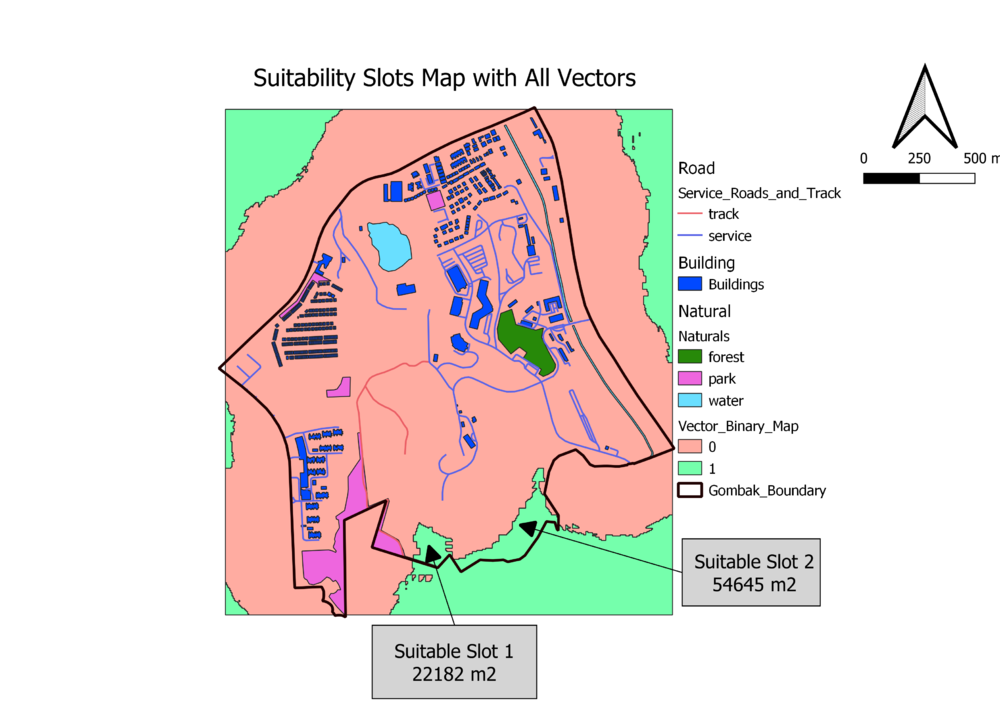
Part Five - Suitability land lots layout
