SMT201 AY2019-20T1 EX2 Lim Jia Khee
Revision as of 00:52, 10 November 2019 by Jiakhee.lim.2015 (talk | contribs) (→Part 1: Data visualisation of vector layers)
Contents
Part 1: Data visualisation of vector layers

| Views (from top left to bottom left, clockwise direction) | Description (within 100 words) |
|---|---|
| After filtering our initial road layer for two types of roads, namely Service and Track roads, there are a total of 188 different road osm_id. Of the 188 different road types, there are only two track roads and the remaining 186 roads being of service type. | |
| There was no filtering done for this building layer. Of 527 different building osm_id there were only 22 rows where the building types were listed. The remaining 505 rows did not specify their building type. | |
| The lowest ground in Gombak Planning subzone is 9 metres above sea level, while the highest ground in Gombak Planning subzone is 145 metres above sea level. From the Digital Elevation Map (DEM), the elevation of Gombak appears to follow that of a small hill. | |
| After filtering for only parks, water and forest nature types, there are eight such features present in Gombak Planning subzone. Forest features are denoted with a shade dark green as compared to the park features. |
Part 2: Proximity Analysis, Raster Layers

| Views (from top left to bottom left, clockwise direction) | Description (within 100 words) |
|---|---|
Part 3: Standardisation of Proximity Analysis, Min-Max method

| Views (from top left to bottom left, clockwise direction) | Description (within 100 words) |
|---|---|
Part 4: Analytical Hierarchical Process (AHP) input matrix and result report
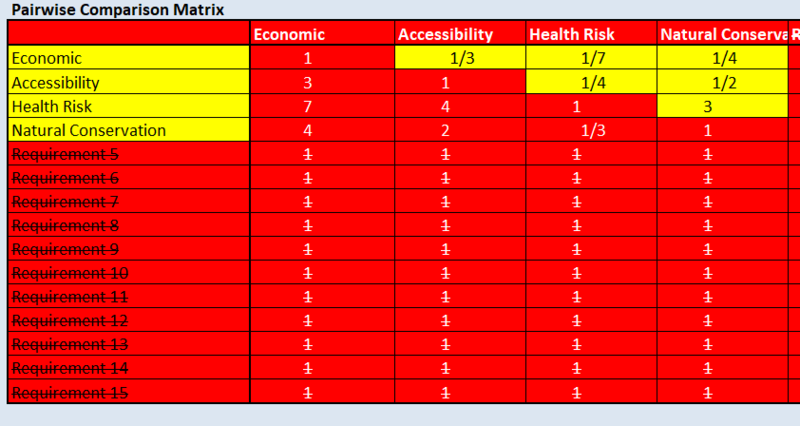 |
 |
| Data | Source | Data Description | Source URL | Data Type |
|---|---|---|---|---|
Part 5: Suitable landlot(s) identified

| Data | Source | Data Description | Source URL | Data Type |
|---|---|---|---|---|