SMT201 AY2018-19T1 EX1 Goh Jia Sheng
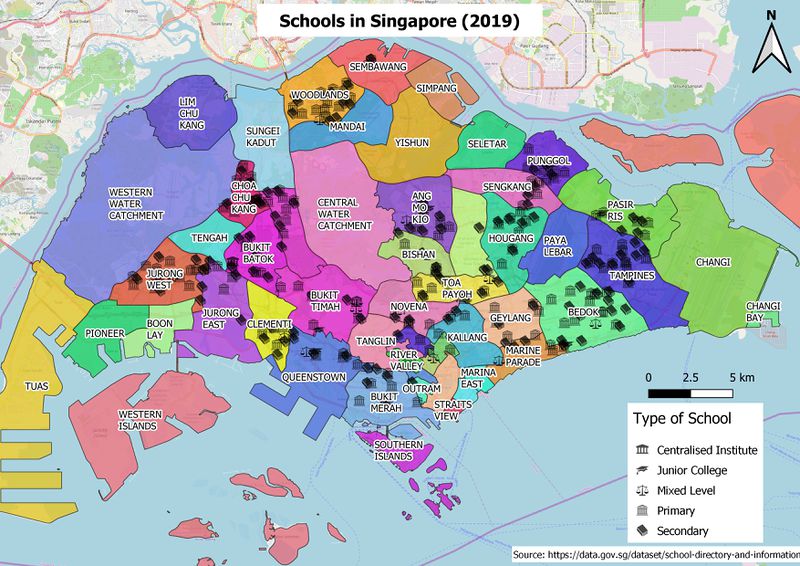
Q1a. Using school information from data.gov.sg, prepare a thematic map showing the distribution of public education institution by school types such as primary, secondary, etc.
| 8 || Lights Power || Despite the consistent total Lights power consumption, there is some interesting pattern to it. Lights power in the first floor is generally not turned off. Much of the power consumption comes from the 1st floor. Even past working hours, the 1st floor still consumes significantly high power, while the rest of the floors' consumption dropped to their minimal level. What is more surprising is that the zones, 8A, 8B, and 11B reflect the lights consumed in corridors. It appears that the building is not really energy efficient after all!
|- The distribution of schools across Singapore are categorised into the different types of schools and shown using pictorial symbols. It gives a clear picture of the number of schools in each town. From the map, we can see that the primary and secondary schools are generally distributed evenly across these towns. However, the upper education schools are lacking in the west side and concentrated in the south side of Singapore. It is possible to expect more upper education schools to be built in the west side with the development of Tengah area in the near future
