SMT201 AY2019-20G2 Ex2 Lu Zhimao
Contents
- 1 Part One: A map layout with four views
- 2 Part Two: A map layout with four views(Proximity)
- 3 Part Three: A map layout with four view showing the criterion scores of each factor layer
- 4 Part Four: An Analytical Hierachical input matrix and result report
- 5 Part Five: A map layout with the suitability land lot(s)
Part One: A map layout with four views
The study area and the target roads
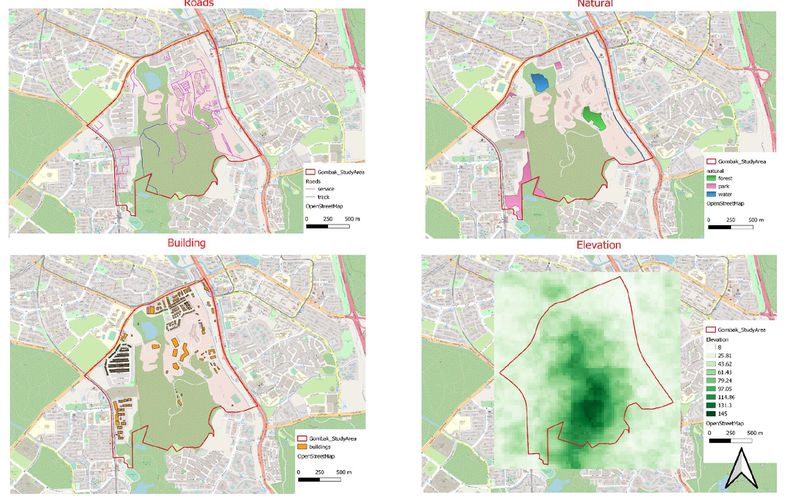
Using Selection by Location feature, I extracted the roads that falls within Gombak study area, followed by the filtering of roads to sieve out the relevant roads namely – service and track which are depicted by the colors blue and purple respectively. There are a total of 199 services roads and 2 track roads where most of the roads are located towards the right-hand side of the study area.
The study area and buildings
Using Selection by Location feature, the extraction of the buildings is done. Buildings are generally in clusters except for a few which are built at a higher elevation. The buildings located at the lower elevations might be more easily accessible by more roads due to lesser slopes and more road connections as opposed to the buildings at the higher elevation. Most of the buildings located at the lower elevation tend to have more facilities located near them such as parks, roads and water bodies compared to those buildings at the higher elevation. However, those buildings at the higher elevation would have a better overview.
The Study area and the target natural features
After extracting Naturals which falls within the Gombak study area through the Selection by Location feature function, I have identified 3 water bodies, 1 forest and 4 parks. The water body, forest and parks are represented by the colors light blue, green and darker pink respectively. All the natural attractions are located away from the center of the study area due to the elevation level.
The study area and digital elevation
The highest elevation points fall in the lower-center parts of the Gombak study area which is 145m above sea level and the lowest elevation points fall in the top, left and right parts of the Gombak study area which is 8m above sea level. Most of the roads, buildings and natural attractions tend to build at a relatively lower elevation level apart from the five buildings which are built at the highest elevation. An important information to take note of is that during the process of creating slope layer, the QGIS system tends to auto-remove one row of pixels away from each side of the Aster_GDEM layer. In order for the slope layer to cover up the entire study area, when extracting clip raster by extent the clipping extent (xmin, xmax, ymin,ymax) has to be adjusted to a slightly bigger scale so that even after creating the slope layer the study area will still falls within the slope layer.
Part Two: A map layout with four views(Proximity)
the study area and Proximity to target roads layer
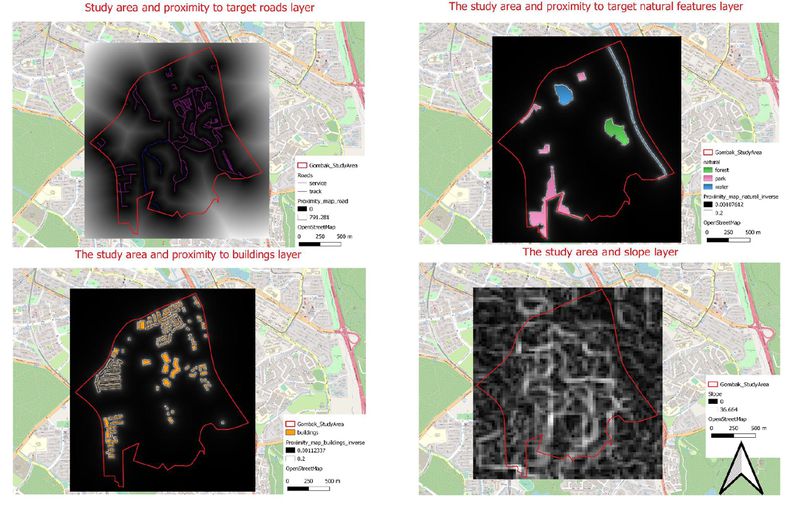
The distance from land lot to the nearest road is 0m and represented by blacks and furthest distance is 791.281m and represented by the whites. By looking at the color we can determine where is the ideal location to build the quarantine building on the requirement. As mentioned in the above, due to the accessibility factor, we should build the building nearer to the roads hence we should pay more attention to those areas represented by the blacks. Areas in whites are not as accessible because there are either no road or lesser roads as compared to the area in blacks as it is located further away from the roads, which might not be the ideal location to build the quarantine building.
the study area and Proxmity to target natural features layer
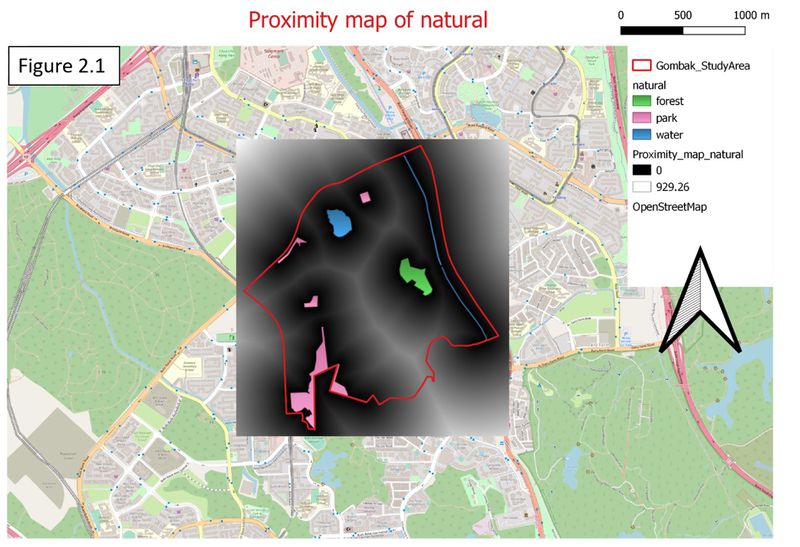
The land lot represented by whites have the highest suitability to build quarantine building as it have the furthest distance (929.26m) away from the natural attractions. When the color change from whites to a darker color it means the distance is getting nearer to the natural attractions until it reaches to 0m which is represented by blacks (refer to figure 2.1). However, the requirement for natural is different from factors like economic and accessibility. For natural conversation factor, the selected site should be away from forested land, park and water. Therefore, in order to standardize across all 4 different factors, I have to inverse natural conversation factor first(1/proximity map of natural), so that it comes to a common agreement that those areas nearer to natural conversation, residence area, road and flat ground would be represented by whites and when the distance or slope degree increases the color also change to a darker color. After inversing the natural conversation factor, the minimum number is 0.00107612 and the maximum number is 0.2.
the study area and Proxmity to building layer
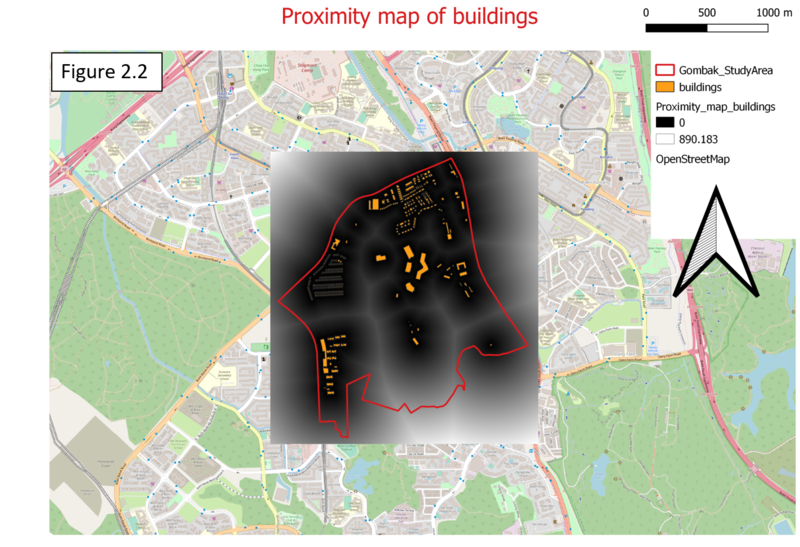
The land lots represented by whites have the highest suitability to build quarantine building as it has the furthest distance (890.183m) away from the housing areas or offices. When the color changes from whites to a darker color it means that the distance is getting nearer to residential areas until it reaches 0m which is represented by blacks (refer to figure 2.2). However, due to health risk factor, the idea location for quarantine building would be build at those land lots represented by white or if not, a lighter color would be preferred. For building, it applies the same concept as natural as it mentioned in the task that the selected site should be away from population i.e. housing areas and offices in order to avoid disease spreading to the nearby population. Therefore, inverse health risk factor (1/proximity map of building) would be required. After inverse the health risk factor, the minimum number is 0.00112337 and the maximum number is 0.2.
the study area and slope layer
The economic factor is based on slope and it is derived from proximity to elevation, those land lots represented by blacks have a flatter ground of 0 degree and land lots represented by whites with elevated ground of 36.664 degree. Both left and right-hand side of the study area tend to have a flatter ground compared to area in the center of the study area. From the slope layer we can infer that the center of the study area might not be an ideal location to build quarantine building as it stated in the task that the selected site should avoid steep slope. This is because construction at steep slope tends to involve a lot of cut-and-fill and will lend to relatively higher development cost.
Part Three: A map layout with four view showing the criterion scores of each factor layer
Accessibility Factor
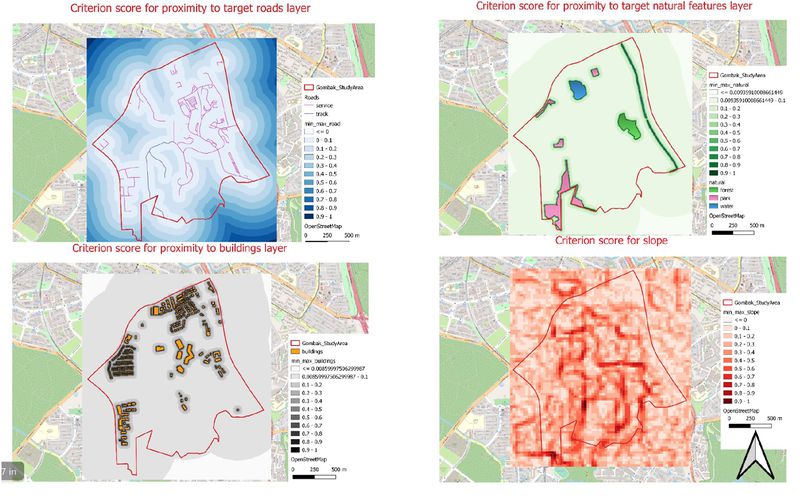
In order to derive a criterion score, a min-max standardization technique is required. The minimum number is 0 and the maximum number is 791.281. By inserting the numbers into the formula then an equation is formed; min-max = proximity map of road / 791.281. Then, the criterion score is formed, and the score is from 0 to 1 and the lower the criterion score the more suitable it is. Those lots with scores 0 are represented by white and when the score number increases, the color changes to a darker color till reaches blue. As mentioned in the above, the quarantine building should be built near to the road, therefore, those suitable lots would be represented by a smaller criterion score number. In order to meet the selection requirement, the lots with a lighter color should be the focal point.
Health risk Factor
By applying min-max standardization technique, the criterion score is formed, and the score is from 0.00561683 to 1 and the lower the criterion score the more suitable it is. Those lots with a score of 0.00561683 are represented by light greys and when the score number increase, the color also changes to a darker color till reaches blacks. As can see from the min-max health risk factor, those buildings are surrounded by black and when distance getting further away from the buildings, the color also start change to a lighter color. In order to meet the selection requirement, the lots with a lighter color should be the focus point.
Natrual Conversation Factor
By applying min-max standardization technique, the criterion score is formed, and the score is from 0.00538062 to 1 and the lower the criterion score the more suitable it is. Those lots with a score of 0.00538062 are represented by light greens and when the score number increases, the color also changes to a darker color till reaches dark green. As seen from the min-max natural conversation factor, those natural attractions are surrounded by dark green and when distance gets further away from the natural attractions, the color also start change to a lighter color. In order to meet the selection requirement, the lots with a lighter color should be the focal point
Economic Factor
In order to derive a criterion score, a min-max standardization technique is required. The minimum number is 0 and the maximum number is 36.664. By inserting the numbers into the formula then an equation is formed; min-max = proximity map of slope / 36.664. Then, the criterion score is formed, and the score is from 0 to 1 and the lower the criterion score the more suitable it is. Those lots with score 0 are represented by light pinks and when the score number increases, the color changes to a darker color till reaches red. By using a different color to represent each criterion score, it helps to identify those suitable area easily. As can see from the min-max slope layer, those areas in the center of the study area tend to carry with higher criterion score compared to those areas at both sides. In order to meet the selection requirement, the lots with a lighter color should be the focus points.
Part Four: An Analytical Hierachical input matrix and result report
Result Report
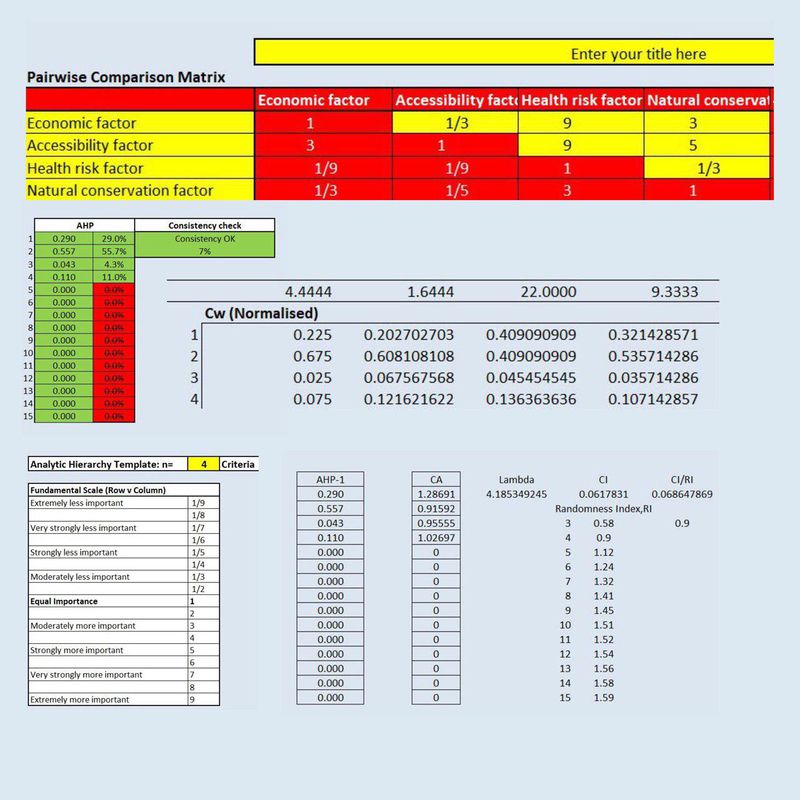
By using the pairwise comparison Matrix, I am able to generate an AHP scoreboard for all 4 factors. Factors that carries a higher percentage weightage will have a direct impact on selecting a suitable lot. The scale of each input under the pairwise comparison matrix is based on the individual analysis. For example, when comparing economic factor with health risk factor, I ranked health risk factor extremely more important than economic factor. One of the reasons is when health risk factor is being negated, there would be a higher possibility that more people will get affected by the disease. Therefore, we can conclude, resident’s health is definitely more important than development costs. After inserting each scale, one important factor I have to take note of is the consistent check, in general, if the consistent check is less than 10%, satisfaction of judgement may be derived. Since the consistent check is at 7%, therefore, I can use the AHP score for suitable land lot calculation in the later stage.
- Economic factor: 29%
- Accessibility factor: 55.7%
- Health risk factor: 4.3%
- Natural conversation factor: 11%
By adding up all the factor’s percentage, it gives 100% in total.
Part Five: A map layout with the suitability land lot(s)
Step 1
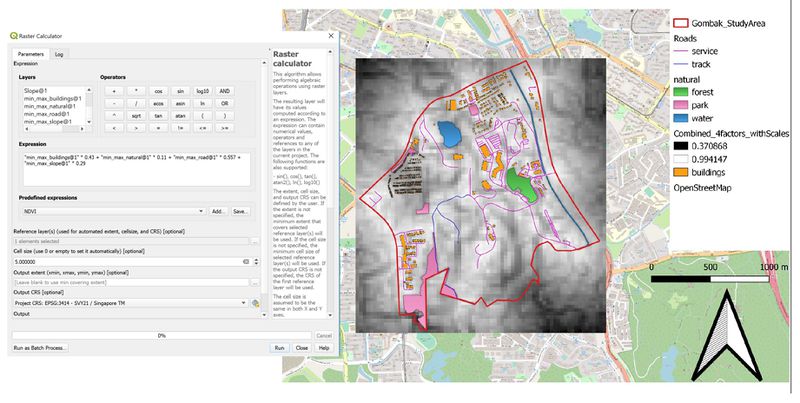
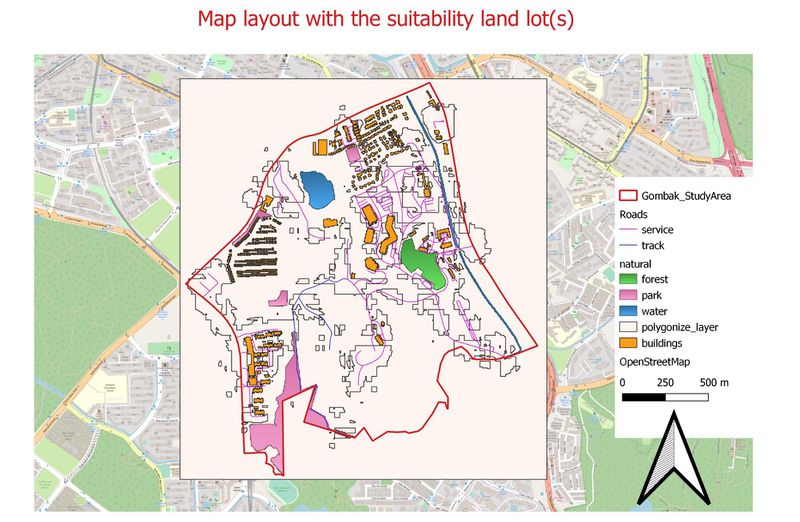
In order to have a suitable lot to build quarantine building, we have to take note of the AHP weightage that each factor carries. By multiplying the individual AHP weightage to respective factor, it finalizes the min-max standardization of each factor based on the percentage calculated in AHP. By combining 4 min-max standardization layers together, it then gives a final single layer to identify which are the areas suitable for quarantine building.
Step 2
As it mentioned in the criterion score step, the lower the criterion score the more suitable it is, similarly it also applies to the combined layer. However, in order to ease my data selection, I have to inverse criterion score for the combined layer to achieve the higher the percentage in criterion score the more suitable it is.
Step 3
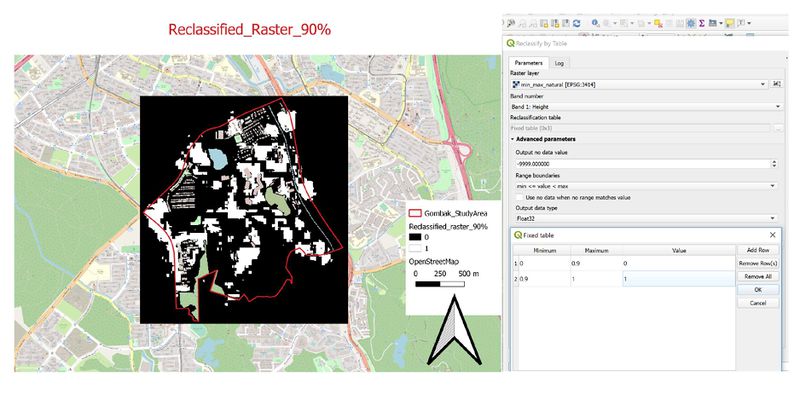
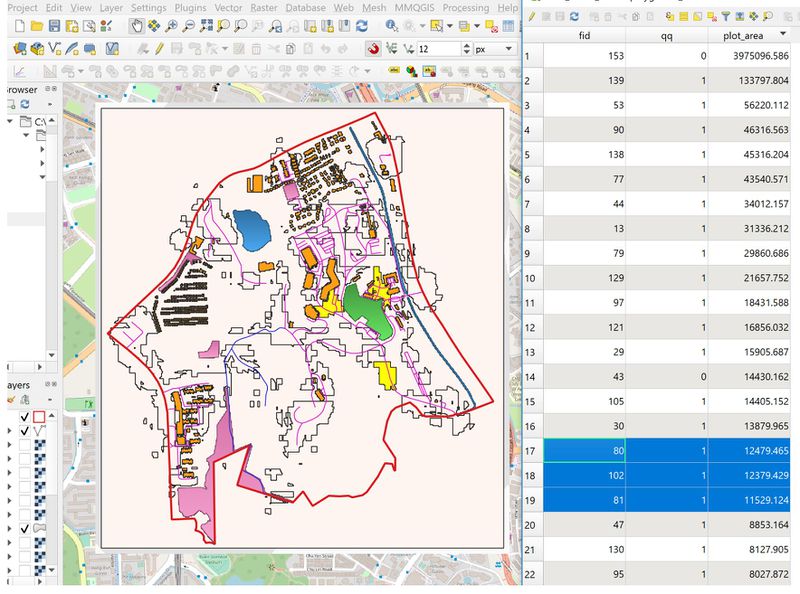
However, in order to figure out the most suitable lots, I have to set a cutoff point by using reclassification by table. In this case, I set my suitable percentage to be 90% and it means those lots with less than 90% will not in my consideration and only those carries more than 90% will be qualify for selection. For those with a range from 0% to 90% will be assigned to value 0 and those above 90% will be assigned to value 1. The purpose of doing this is for polygonised in the later stage.
Step 4
After converting the combined layer into multi-polygon, I further calculate their area according to their respective polygon and select 3 areas that nearest to 10000m2. After analyzing all the required factors against the selected area, I decided the bottom right area to be the most suitable lot to build a quarantine building. However, there are more than 1 suitable lots and the reason why I never choose other lots is because I want the size of the lots to keep as close as the required size. If the right size of the lot is able to serve all purposes, there is no need to require a bigger lot.
