Difference between revisions of "SMT201 AY2019-20G2 Ex1 LoisLek"
Jump to navigation
Jump to search
| Line 1: | Line 1: | ||
==Part One: Thematic Mapping== | ==Part One: Thematic Mapping== | ||
| − | <p> Distribution of Public Education Institutions by School Type </p> | + | '''<p> Distribution of Public Education Institutions by School Type </p>''' |
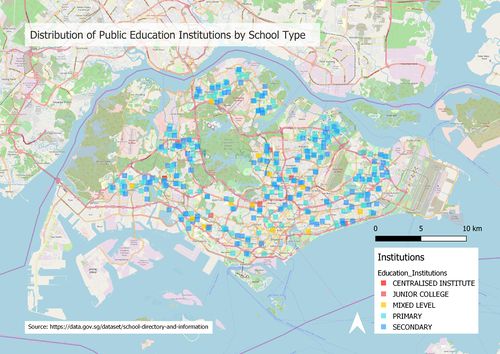
[[File:Education Institutions.jpg|thumb|Distribution of Public Education Institutions by School Type| left| 500px]] | [[File:Education Institutions.jpg|thumb|Distribution of Public Education Institutions by School Type| left| 500px]] | ||
<br> | <br> | ||
| − | <p> The data used for the Education Institutions layer is the School Directory and Information data from Data.gov. The data was geocoded using MMQGIS and categorised according to school type. The squares provide an overview of the distribution of schools. The purpose of using squares is to give a more accurate representation of the area of each school. </p> | + | ''<p> The data used for the Education Institutions layer is the School Directory and Information data from Data.gov. The data was geocoded using MMQGIS and categorised according to school type. The squares provide an overview of the distribution of schools. The purpose of using squares is to give a more accurate representation of the area of each school. </p> |
| − | <br> | + | <br>'' |
Revision as of 01:16, 15 September 2019
Part One: Thematic Mapping
Distribution of Public Education Institutions by School Type
The data used for the Education Institutions layer is the School Directory and Information data from Data.gov. The data was geocoded using MMQGIS and categorised according to school type. The squares provide an overview of the distribution of schools. The purpose of using squares is to give a more accurate representation of the area of each school.
