Difference between revisions of "SMT201 AY2019-20G1 EX2 Eddie Leow Kian Giap"
| Line 24: | Line 24: | ||
=== Gombak and Proximity to Buildings=== | === Gombak and Proximity to Buildings=== | ||
| + | The shading of the proximity to buildings is by the gradient between black and white. Black being the nearest to the buildings and white being the furthest away from buildings. The gradient of black and white provides a good and clear visualization of proximity to the buildings. This helps to determine where should CDQC be located at as it should be away from population. | ||
=== Gombak and Proximity to Natural Features=== | === Gombak and Proximity to Natural Features=== | ||
| + | |||
=== Gombak and Proximity to Slope=== | === Gombak and Proximity to Slope=== | ||
Revision as of 16:53, 10 November 2019
Contents
- 1 Task
- 2 Part 1: Gombak and Roads, Buildings, Natural Features and Digital Elevation
- 3 Part 2: Gombak and Proximity to Roads, Buildings, Natural Features and Slope
- 4 Part 3: Criterion Scores of Each Factor Layers
- 5 Part 4: Analytical Hierarchical Process (AHP) Input Matrix & Result Report
- 6 Part 5: The Suitability Land Lot(s)
Task
To identify a location suitable for building a national Communicable Disease Quarantine Centre located at Gombak planning subzone with a contiguous area of at least 10,000m2.
Part 1: Gombak and Roads, Buildings, Natural Features and Digital Elevation
Gombak and Roads
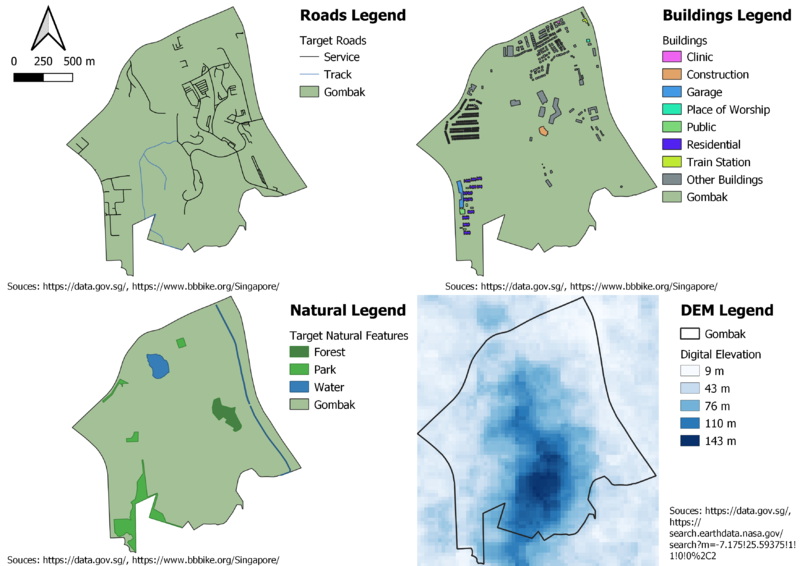
This map layout will helps to identify the potential area to build the national Communicable Disease Quarantine Centre (CDQC) as the selected site should be close to existing service roads and tracks. Non service roads and tracks are not displayed in this map layout as the task is looking at target roads with study area (Gombak).
Gombak and Buildings
Based on the map layout, there are many types of buildings at Gombak such as clinics, constructions, garages, place of worship, public area, residential, train station and other buildings including private area. With the map layout, it aids in identifying the potential area to build the CQDC as the site should be away from population which means away from buildings.
Gombak and Natural Features
In this map layout, it helps to identify natural features such as forest, park and water at Gombak. This is to avoid the site being built near to these natural features and conserves the natural features.
Digital Elevation Model (DEM)
The tone of colour is used to identify the steepness of slope. The darker the blue, the steeper the slope. The lighter the blue, the less steep the slope. CQDC should avoid steep slope. With this map layout, it can helps to identify potential area with lesser degrees of slope. Therefore, lesser development cost to cut-and-fill.
Part 2: Gombak and Proximity to Roads, Buildings, Natural Features and Slope
Gombak and Proximity to Roads
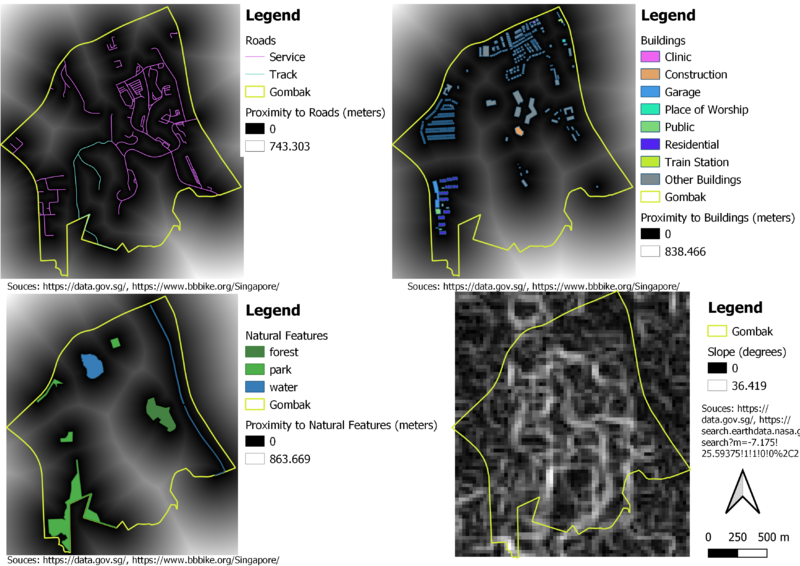
Black being the nearest to the existing roads and white being the furthest away from roads. The tone range between black and white provides a good and clear visualization of proximity to roads. This helps to determine where CDQC should be site at Gombak based on the proximity to roads.
Gombak and Proximity to Buildings
The shading of the proximity to buildings is by the gradient between black and white. Black being the nearest to the buildings and white being the furthest away from buildings. The gradient of black and white provides a good and clear visualization of proximity to the buildings. This helps to determine where should CDQC be located at as it should be away from population.
Gombak and Proximity to Natural Features
Gombak and Proximity to Slope
Part 3: Criterion Scores of Each Factor Layers
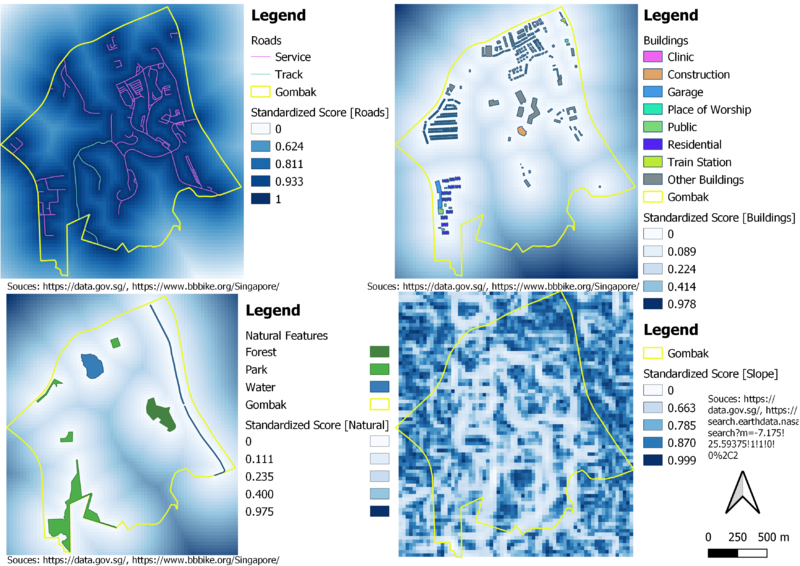
Among all the criteria standardisation techniques, Min-Max technique will be apply to standardize the four raster layers from Part 2 to derive their criterion score.
Let X be the value.
The formula of Min-Max technique is [(X - Min) / (Max - Min)].
Criterion Score for Roads
Formula (in meters): 1 - [(X - 0) / (743.303 - 0)]
The higher the standardized value the nearer it is to the existing service roads and tracks.
The reason why there is a 1 subtracting Min-Max formula is to inverse the standardized value. The existing Min-Max technique will give a standardized value where the higher the standardized value, the further it is to the existing service roads and tracks. However, the decision factor for accessibility is to have the selected site close to existing service roads and tracks.
Criterion Score for Buildings
Formula (in meters): (X - 0) / (838.466 - 0)
The higher the standardized value, the further it is away from the buildings.
Criterion Score for Natural Features
Formula (in meters): (X - 0) / (863.669 - 0)
The higher the standardized value, the further it is away from forested land, park and water.
Criterion Score for Slope
Formula (in degrees): 1 - [(X - 0) / (36.419 - 0)]
The higher the standardized value, the lower the degree of the slope.
The reason why there is a 1 subtracting Min-Max formula is to inverse the standardized value. The existing Min-Max technique will give a standardized value where the higher the standardized value, the higher the degree of the slope. However, the decision factor for economic is the selected site should avoid steep slope.
