Difference between revisions of "Land Suitability Analysis"
| Line 3: | Line 3: | ||
This will give me the following, one which is unclipped and another one clipped using the Gombak_SZN layer as layer extent. | This will give me the following, one which is unclipped and another one clipped using the Gombak_SZN layer as layer extent. | ||
[[File:Unclippedfinalraster.png|300px|left]] | [[File:Unclippedfinalraster.png|300px|left]] | ||
| − | [[File:Clippedfinalraster.png| | + | [[File:Clippedfinalraster.png|400px|right]] |
| + | <br> | ||
[[File:AHPstyle.png|200px|center]] | [[File:AHPstyle.png|200px|center]] | ||
| + | |||
| + | |||
Revision as of 16:18, 10 November 2019
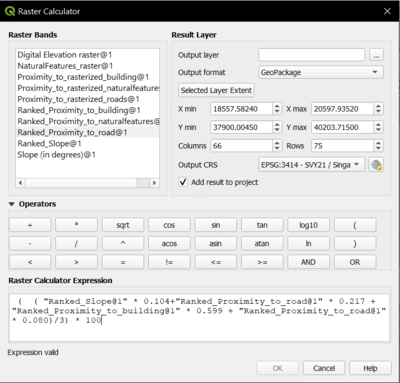
After getting the weights from the AHP, we will now use the raster calculator to combine all the ranked raster model to give a final raster layer which takes into account all the ranked model with the values we have given in the reclassified table. I want to count it in terms of percentage which is why I have divided with the maximum value of the raster calculation which is 3 and multiply by 100.
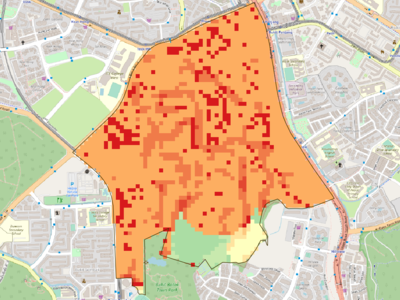
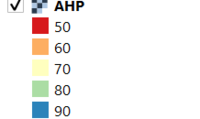
This will give me the following, one which is unclipped and another one clipped using the Gombak_SZN layer as layer extent.
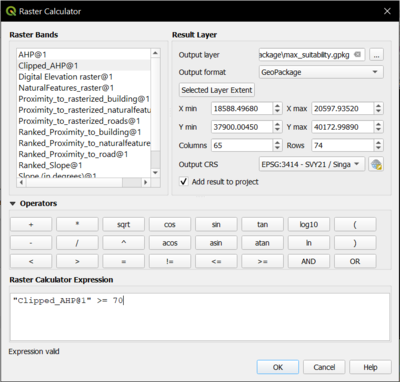
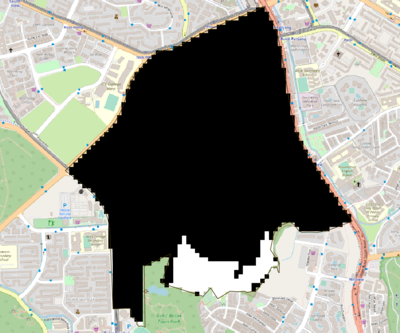
Next, we will do another raster calculation which will give us the desired location in a raster layer by selecting by expression of “Clipped_AHP >= 70” meaning that we want to get the raster layer which has a value of more than or equal to 70%.
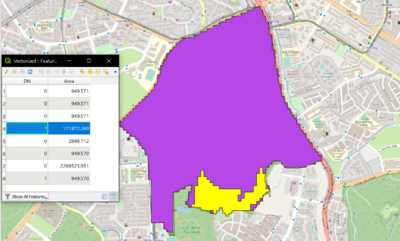
This will give us the following and we will polygonise this layer to obtain the vector layer. Using field calculator, we will get the area of the vector layer by creating a new column with the function $area.
