Difference between revisions of "AHP"
Jump to navigation
Jump to search

| Line 8: | Line 8: | ||
[[File:AHP_consistency.png|400px|center]] | [[File:AHP_consistency.png|400px|center]] | ||
| − | + | <big> | |
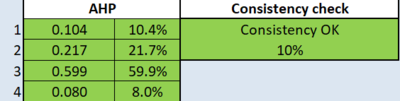
| − | <big>* '''Economic factor (slope)'''= 0.104 | + | * '''Economic factor (slope)'''= 0.104 |
* '''Accessibility factor (roads)'''= 0.217 | * '''Accessibility factor (roads)'''= 0.217 | ||
* '''Health risk factor (building)'''= 0.599 | * '''Health risk factor (building)'''= 0.599 | ||
* '''Natural conservation factor''' = 0.080</big> | * '''Natural conservation factor''' = 0.080</big> | ||
Revision as of 15:27, 10 November 2019
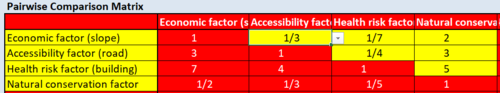
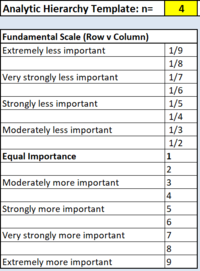
Using Excel-based AHP library such as the AHP Template provided by SCB Associates, the 4 decision factors which are Economic factor (slope), Accessibility factor (road), Health risk factor (building) and Natural conservation factor are ranked against each other according to their importance and inputted into the AHP pairwise comparison matrix. Using the scale provided, I have given the values as such:


This will give me the weights for each decision factor and the CI/RI is 0.9 which falls under 10% or below indicating that our paired comparisons are consistent.


- Economic factor (slope)= 0.104
- Accessibility factor (roads)= 0.217
- Health risk factor (building)= 0.599
- Natural conservation factor = 0.080