Difference between revisions of "SMT201 AY2019-20G2 EX2 Neo Yin Li Amelia"
| Line 20: | Line 20: | ||
== Part 2: Map Layout with four views (Proximity) == | == Part 2: Map Layout with four views (Proximity) == | ||
| + | [[File:Layout for point 2.jpg|700px|frameless|center|Natural, Roads, Buildings and Slope Proximity Views]] | ||
| + | === Economic factor === | ||
| + | The slope layer shows a range of values from 0 to 36 degrees, where black represent 0 and white represent the highest value of 36 degrees. From the map, most of the central region is relatively steep due to the higher amount of white areas. | ||
| − | + | === Accessibility factor === | |
| + | The proximity layer for road shows a range of values from 0 to 722 metres, where black represent 0 and white represent the highest value of 722 metres. From the map, most of the central region is relatively near the roads, specifically service road and track, which is to ensure easy transportation of building materials during the construction stage. | ||
| − | + | === Health risk factor === | |
| + | The proximity layer for building shows a range of values from 0 to 827 metres, where black represent 0 and white represent the highest value of 827 metres. From the map, most of the northern and western region is relatively near the buildings i.e. housing areas and offices which means these regions are near the general population. | ||
| − | + | === Natural conservation factor === | |
| − | + | The proximity layer for natural shows a range of values from 0 to 864 metres, where black represent 0 and white represent the highest value of 864 metres. From the map, most of the south-western, north-western and east regions are relatively near the nature features, specifically forested land, park and water. | |
| − | Natural conservation factor | ||
Revision as of 21:52, 9 November 2019
Contents
Part 1: Map Layout with four views
Economic factor
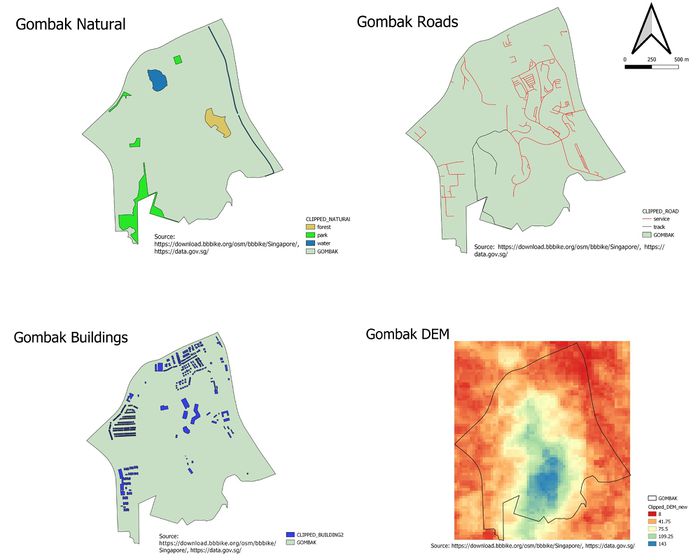
The selected site should avoid steep slopes to reduce the development costs for cut-and-fill construction techniques. The lowest point in Gombak is 8 meters above sea level, depicted in red. The Southern region of Gombak has the highest elevation with 143 meters above sea level, depicted in blue. Most of the nature features, roads and buildings are located on lower level land.
Accessibility factor
The target road consists of service road and track, in which the service road is represented by red lines and track is represented by black line. We can see that there is more service road than track road in Gombak region. The selected site should be close to these roads to ensure easy transportation of building materials during the construction stage. The service roads spread across most of the Gombak planning subzone, and are mostly concentrated in the North-East region, whereas the 2 tracks are located at the South and central region of Gombak
Health risk factor
In Gombak, there are clinic, construction site, garage, place of worship, public, residential and train station infrastructures. However, many buildings are not categorised into any of these types. Hence, categorisation of the buildings based on types do not occur as the buildings that do not have any “type” will not show up on the map if the “unknown” category is removed from the categorisation. Also, there is no point doing so. All buildings help to identify the health risk factor, in which the selected site should be away from the buildings to prevent the diseases from spreading to the general population.
Natural conservation factor
In Gombak, there is a large area of park and small section of forest and water body. The selected site should be also be away from these natural features. The large area of park is near the left region of Gombak. The northern region contains the water body and the western region contain the forest. The forest is depicted with beige colour on the map, while the parks and the water bodies are depicted using neon green and blue respectively.
Part 2: Map Layout with four views (Proximity)
Economic factor
The slope layer shows a range of values from 0 to 36 degrees, where black represent 0 and white represent the highest value of 36 degrees. From the map, most of the central region is relatively steep due to the higher amount of white areas.
Accessibility factor
The proximity layer for road shows a range of values from 0 to 722 metres, where black represent 0 and white represent the highest value of 722 metres. From the map, most of the central region is relatively near the roads, specifically service road and track, which is to ensure easy transportation of building materials during the construction stage.
Health risk factor
The proximity layer for building shows a range of values from 0 to 827 metres, where black represent 0 and white represent the highest value of 827 metres. From the map, most of the northern and western region is relatively near the buildings i.e. housing areas and offices which means these regions are near the general population.
Natural conservation factor
The proximity layer for natural shows a range of values from 0 to 864 metres, where black represent 0 and white represent the highest value of 864 metres. From the map, most of the south-western, north-western and east regions are relatively near the nature features, specifically forested land, park and water.
Part 3: May Layout with four views (Criterion Scores)
Economic factor:
Accessibility factor:
Health risk factor:
Natural conservation factor:
Part 4: Analytical Hierarchical Process
Economic factor
Accessibility factor:
Health risk factor:
Natural conservation factor:
Part 5: Map Layout (Suitability)
Economic factor:
Accessibility factor:
Health risk factor:
Natural conservation factor:

