Difference between revisions of "SMT201 AY2019-20T1 EX2 Lee Wan Ning"
| Line 1: | Line 1: | ||
| + | '''<big>Exercise Objective'''<br><br> | ||
| + | In this exercise, you are tasked to identify a location suitable for building a national Communicable Disease Quarantine Centre. The selected site must be located at Gombak planning subzone, with a contiguous area of at least 10,000m2 and it must meet the following decision factors:<br> | ||
| + | |||
| + | • Economic factor: The selected site should avoid steep slope. This is because construction at steep slope tends to involve a lot of cut-and-fill and will lend to relatively higher development cost.<br> | ||
| + | |||
| + | • Accessibility factor: The selected site should be close to existing local roads, namely: service roads and tracks. This is to ensure easy transportation of building materials during the construction stage.<br> | ||
| + | |||
| + | • Health risk factor: The selected site should be away from population i.e. housing areas and offices in order to avoid disease spreading to the nearby population.<br> | ||
| + | |||
| + | • Natural conservation factor: The selected site should be away from forested land, park and water.<br> | ||
| + | <br> | ||
| + | |||
'''<big>Part 1: Input Layers<big> '''<br><br> | '''<big>Part 1: Input Layers<big> '''<br><br> | ||
| Line 42: | Line 54: | ||
[[File:Analysed Layers.png|600px|center]]<br> | [[File:Analysed Layers.png|600px|center]]<br> | ||
I have performed slope analysis on the digital elevation layer and proximity analysis on the rasterised buildings, roads and naturals layers.<br> | I have performed slope analysis on the digital elevation layer and proximity analysis on the rasterised buildings, roads and naturals layers.<br> | ||
| − | I have also classified the resulting proximity layers according to the range of raster distances(in m) using a common scale. | + | I have also classified the resulting proximity layers according to the range of raster distances(in m) using a common scale.<br> |
| − | Using "proximity_buildings" layer as an example, the higher the value in the legend, the greater the raster distance away from the | + | |
| − | The "slope" layer is classified according to the range of the slope(in degrees).Using "slope" layer as an example, the higher the value in the legend, the higher the value in the legend, the steeper the the land is around the shaded area | + | Using "proximity_buildings" layer as an example, the higher the value in the legend, the greater the raster distance away from the shaded area is from buildings.<br> |
| + | The "slope" layer is classified according to the range of the slope(in degrees).Using "slope" layer as an example, the higher the value in the legend, the higher the value in the legend, the steeper the the land is around the shaded area.<br> | ||
| + | <br> | ||
| + | '''<big>Part 3: Factor Layers<big> '''<br><br> | ||
| + | |||
| + | ''Deliverables''<br><br> | ||
| + | |||
| + | • A map layout with four views showing the criterion scores of each factor layers and a short description of not more than 150 words for each view.<br> | ||
| + | <br> | ||
| + | [[File:Factor Layers.png|600px|center]]<br> | ||
| + | In order to use the analysis layers to derive the criterion scores of the different factor layers, i first standardise them using the z-score method(as shown in the picture below) such that all the data has the same mean of 0 and standard deviation of 1.<br> | ||
| + | [[File:S example.png|600px|center]]<br> | ||
| + | As seen in the picture, to obtain the variables for the calculation of z-score, i have used the function "raster layer statistics" to get the mean and the standard deviation.Then, i used the raster calculator to perform the calculation.<br> | ||
| + | However, i would need to further manipulate the data for slope(Economic) and roads(Accessibility) such that the meaning of the scale matches the decisions that was set by this exercise(refer to Exercise Objective at the top of this page) <br> | ||
Revision as of 15:44, 9 November 2019
Exercise Objective
In this exercise, you are tasked to identify a location suitable for building a national Communicable Disease Quarantine Centre. The selected site must be located at Gombak planning subzone, with a contiguous area of at least 10,000m2 and it must meet the following decision factors:
• Economic factor: The selected site should avoid steep slope. This is because construction at steep slope tends to involve a lot of cut-and-fill and will lend to relatively higher development cost.
• Accessibility factor: The selected site should be close to existing local roads, namely: service roads and tracks. This is to ensure easy transportation of building materials during the construction stage.
• Health risk factor: The selected site should be away from population i.e. housing areas and offices in order to avoid disease spreading to the nearby population.
• Natural conservation factor: The selected site should be away from forested land, park and water.
Part 1: Input Layers
Deliverables
• A map layout with four views showing:
• the study area and the target roads,
• the study area and buildings,
• the study area and the target natural features,
• the study area and digital elevation, and
a short description of not more than 100 words for each view.
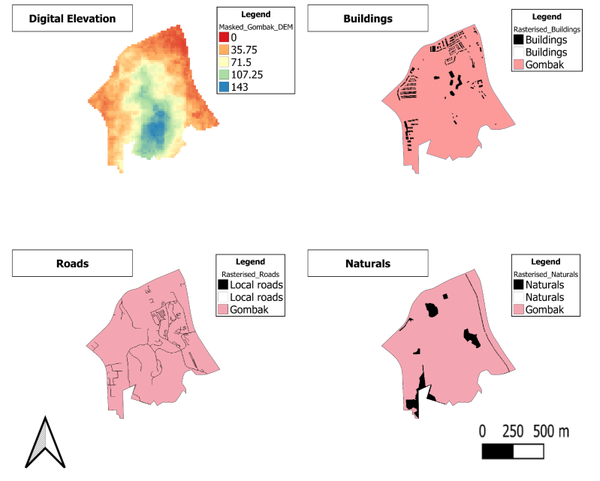
The digital elevation layer is in raster format, whereas the other layers are in vector format.
After importing all the data layers, i have subsequently used the "Clip" function under vector->geoprocessing tools to extract only the area of study, Gombak planning subzone for the vector layers. For the raster layer, i used "Clip Raster By Extent" under raster->extraction.
For the purpose of the analysis later on, i have rasterised all the vector layers.
Furthermore, i have categorised the digital elevation layer according to range of the elevation values(in metres) in the Gombak planning subzone.
For example, yellow shaded areaa on the digital elevation layer would mean that the land there is 71.5m above sea level.
Part 2: Analysed Layers
Deliverables
• A map layout with four views showing:
• the study area and proximity to target roads layer,
• the study area and proximity to buildings layer,
• the study area and proximity to target natural features layer,
• the study area and slope layer, and
• a short description of not more than 150 words for each view.
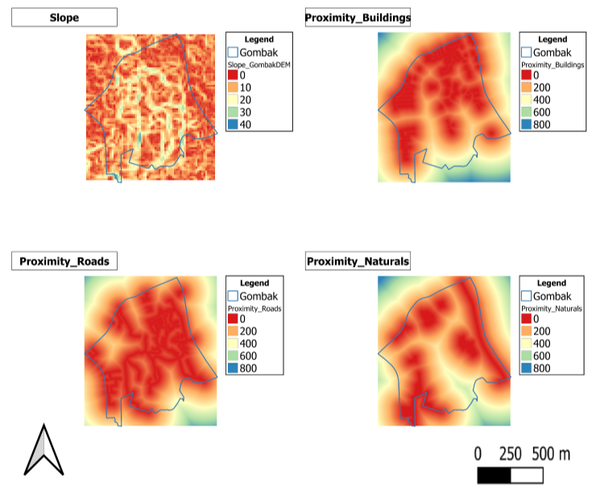
I have performed slope analysis on the digital elevation layer and proximity analysis on the rasterised buildings, roads and naturals layers.
I have also classified the resulting proximity layers according to the range of raster distances(in m) using a common scale.
Using "proximity_buildings" layer as an example, the higher the value in the legend, the greater the raster distance away from the shaded area is from buildings.
The "slope" layer is classified according to the range of the slope(in degrees).Using "slope" layer as an example, the higher the value in the legend, the higher the value in the legend, the steeper the the land is around the shaded area.
Part 3: Factor Layers
Deliverables
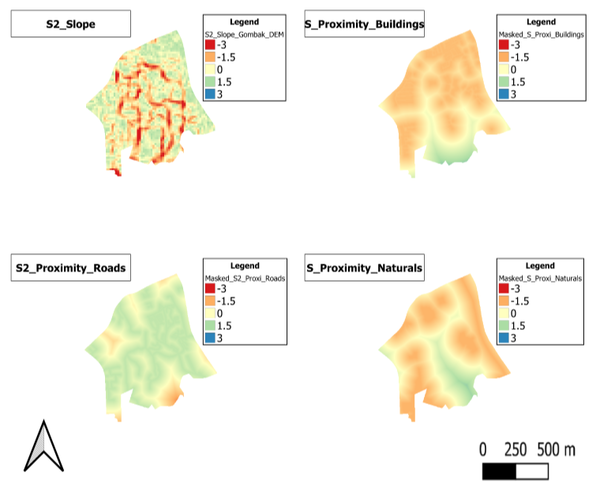
• A map layout with four views showing the criterion scores of each factor layers and a short description of not more than 150 words for each view.
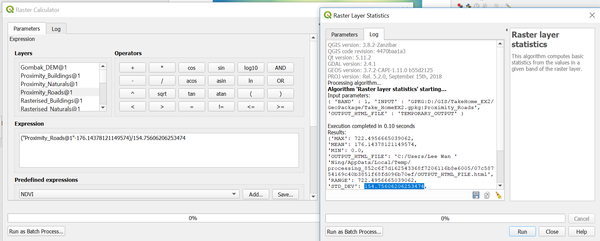
In order to use the analysis layers to derive the criterion scores of the different factor layers, i first standardise them using the z-score method(as shown in the picture below) such that all the data has the same mean of 0 and standard deviation of 1.
As seen in the picture, to obtain the variables for the calculation of z-score, i have used the function "raster layer statistics" to get the mean and the standard deviation.Then, i used the raster calculator to perform the calculation.
However, i would need to further manipulate the data for slope(Economic) and roads(Accessibility) such that the meaning of the scale matches the decisions that was set by this exercise(refer to Exercise Objective at the top of this page)


