Difference between revisions of "SMT201 AY2019-20G2 EX2 Khong Lee Han"
Lhkhong.2018 (talk | contribs) |
Lhkhong.2018 (talk | contribs) |
||
| Line 84: | Line 84: | ||
{| class="wikitable" | {| class="wikitable" | ||
|- | |- | ||
| − | | Economic|| (proxslope_layer-0)/(36.4308-0) | + | | '''Economic'''|| (proxslope_layer-0)/(36.4308-0) |
|- | |- | ||
| − | | Accessibility|| (proxroad_layer-0)/(722.496-0) | + | | '''Accessibility'''|| (proxroad_layer-0)/(722.496-0) |
|- | |- | ||
| − | | Health Risk|| (proxbuildings_layer-0)/(826.62-0) | + | | '''Health Risk'''|| (proxbuildings_layer-0)/(826.62-0) |
|- | |- | ||
| − | | Natural Conservation|| (proxnatural_features-0)/(863.669-0) | + | | '''Natural Conservation'''|| (proxnatural_features-0)/(863.669-0) |
|} | |} | ||
Revision as of 15:18, 8 November 2019
Contents
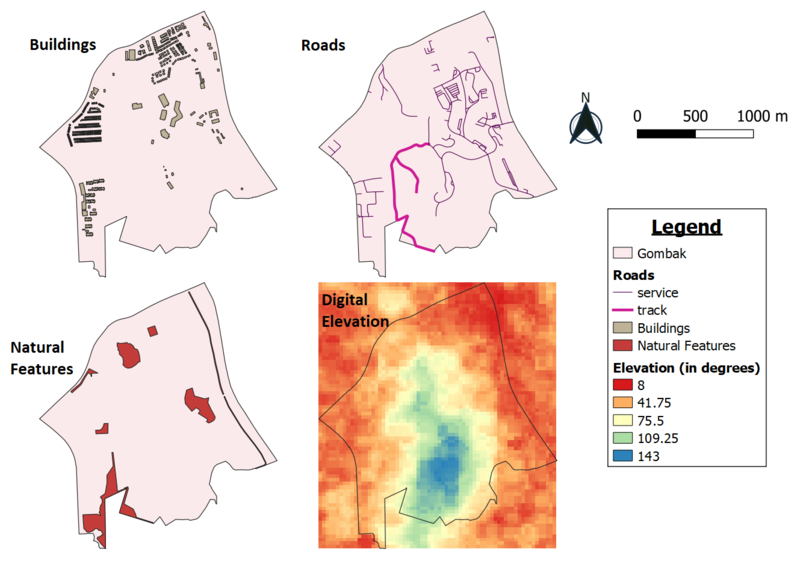
Part 1 : Map View with Study Area and Target Roads, Buildings, Natural Features, Digital Elevations Layer
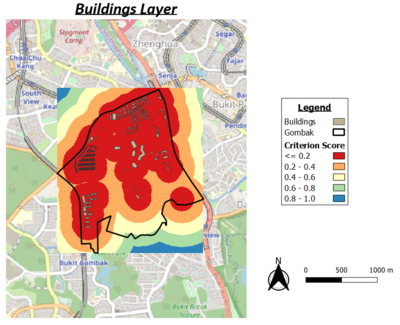
Buildings: To build a disease centre, it needs to be far away from the population to prevent spreading of diseases to the nearby population. The data was extracted from BBBike@Singapore. As Singapore is highly compact, once the disease hits a population, it can easily spread and is important to keep the disease centre away from nearby population.
Target Roads: To build a disease centre, it needs to be close to existing local roads, namely: service roads and tracks to ensure easy transportation of building materials during the construction stage. The data was extracted from BBBike@Singapore. The targeted roads had to be extracted by 'select features using an expression' to extract the service roads and tracks from the 'type' column.
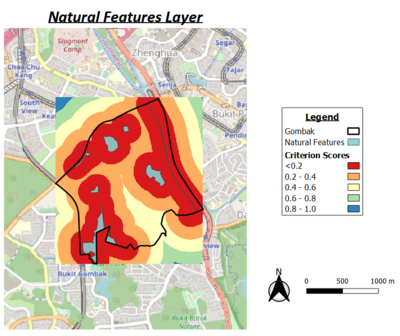
Natural Conservation: The selected site needs to be away from forested land, park and water as when the disease enter the water bodies of Singapore. The data was extracted from BBBike@Singapore.
Elevation: The selected site needs to avoid slope as this will incur large construction cost as steep slopes involves a lot of cut-and-fills and leads to relatively higher development costs. The data was extracted from NASA's EarthData Search Site and was prepared by importing the raster data into QGIS. The higher the value, the higher the elevation of the location , measured in degrees.
Part 2: Proximity Map Layers
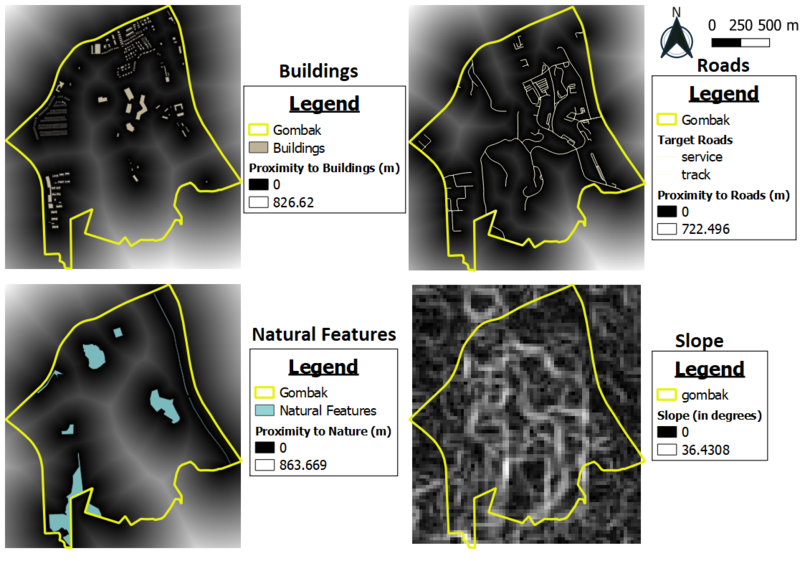
Preparation for Proximity Calculation : To prepare the proximity layer, the vector layers of (buildings,roads, natural) needs to be rasterised such that the proximity of the features can be calculated. Proximity (Raster Distance) needs to the input GIS layer in raster format.
Buildings: The furthest distance from any point to a building within the Gombak study area is 826.62m whereas the closest distance to a building is 0m.
Target Roads: The furthest distance within the Gombak study area to a road is 722.496m and the closest distance is 0m.
Natural Conservation: The furthest distance within the Gombak study area to natural features is 863.669m and the closest distance is 0m.
Elevation: The minimum and maximum of slope features within Gombak is 0 and 36.4308 degrees respectively.
Part 3: Criterion Score of Factor Layers
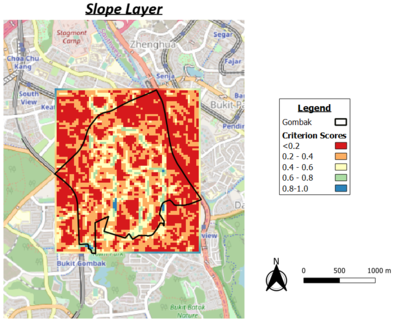
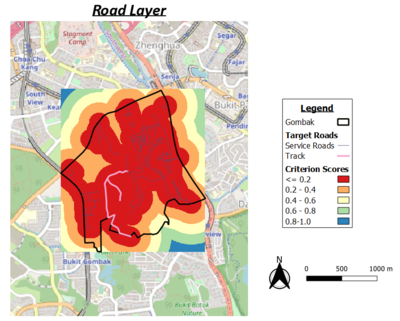
In order to normalize the data, the min-max method was used to standardize the layers.
| Economic | (proxslope_layer-0)/(36.4308-0) |
| Accessibility | (proxroad_layer-0)/(722.496-0) |
| Health Risk | (proxbuildings_layer-0)/(826.62-0) |
| Natural Conservation | (proxnatural_features-0)/(863.669-0) |
abcsdhfdjshf
sfsdgs
gfdgjfd
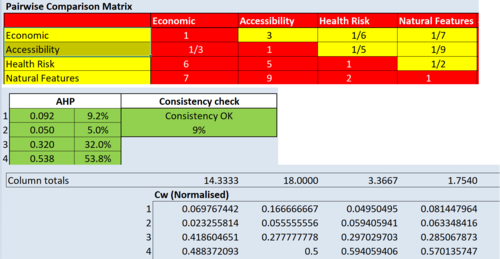
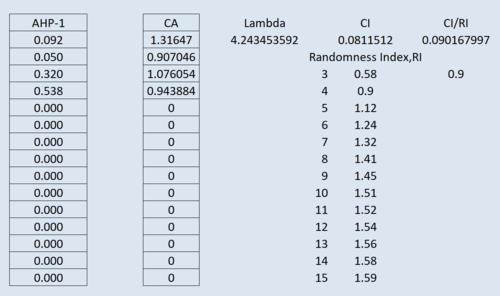
Part 4: Analytical Hierarchical Process Input Matrix & Approach
