Difference between revisions of "SMT201 AY2019-20G2 Ex1 FOO CHUAN GENG"
Jump to navigation
Jump to search
Cgfoo.2018 (talk | contribs) |
Cgfoo.2018 (talk | contribs) |
||
| Line 25: | Line 25: | ||
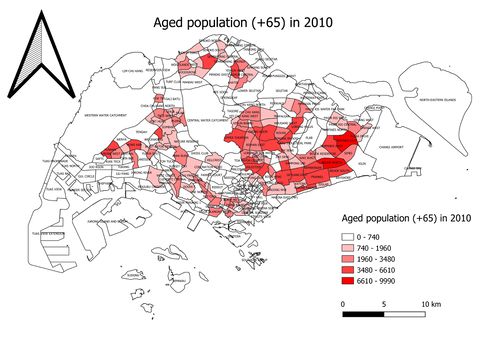
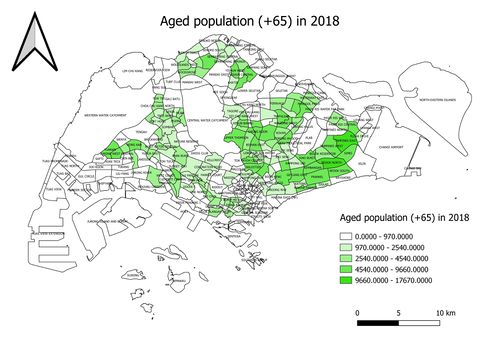
* Aged population (+65) in 2010 and 2018. | * Aged population (+65) in 2010 and 2018. | ||
| − | [[File:AGE65 2010.jpg| | + | [[File:AGE65 2010.jpg|none|500px|caption]] |
| − | [[File:AGE65 2018.jpg| | + | |
| + | |||
| + | [[File:AGE65 2018.jpg|none|500px|caption]] | ||
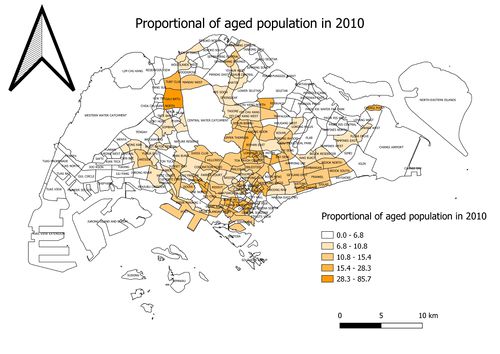
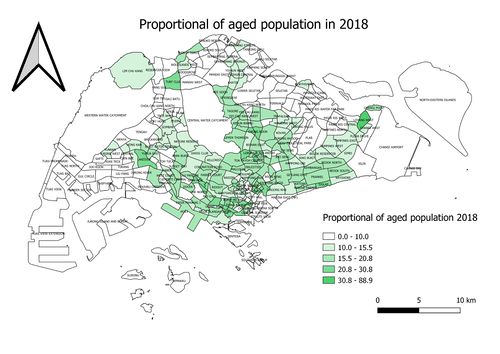
* Proportional of aged population in 2010 and 2018. | * Proportional of aged population in 2010 and 2018. | ||
| − | [[File:AGEPROP2010.jpg| | + | [[File:AGEPROP2010.jpg|none|500px|caption]] |
| − | [[File:AGEPROP2018.jpg| | + | [[File:AGEPROP2018.jpg|none|500px|caption]] |
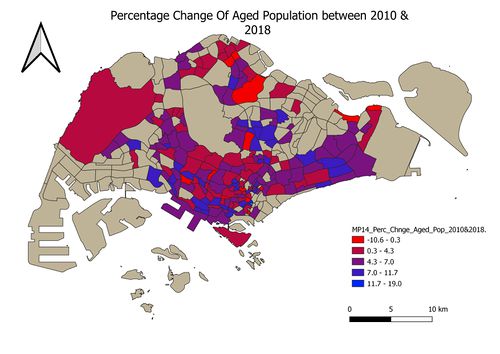
* Percentage change of aged population between 2010 and 2018. | * Percentage change of aged population between 2010 and 2018. | ||
| − | [[File:PerChnge.jpg| | + | [[File:PerChnge.jpg|none|500px|caption]] |
Revision as of 23:34, 16 September 2019
Part 1: Thematic Mapping
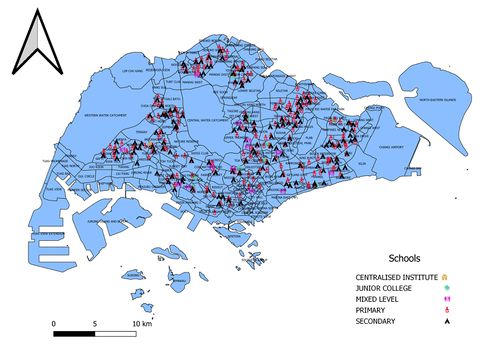
- Distribution of public education institution

I have use the code provided by our coursemate to plot the school data points as using mmqgis will result in missing data points
Classified the data according to its school types, which each data points having a unique symbol ...
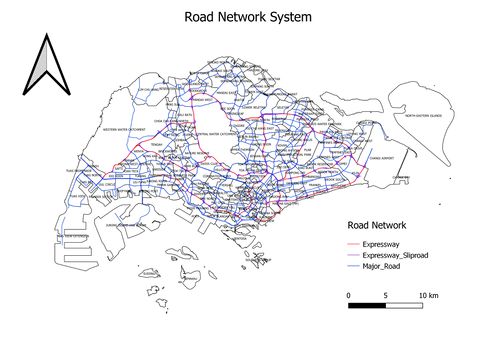
- Hierarchy of road network system

I classify the road network according to its road types , there are 3 different road types differentiated by different colours
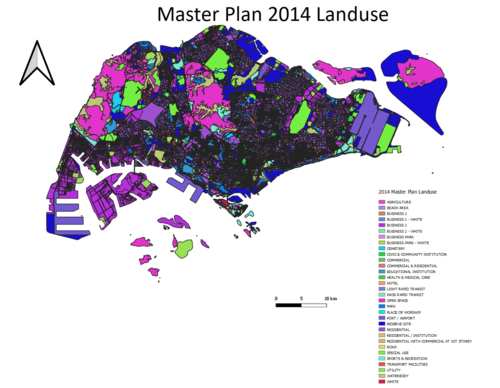
- 2014 Master Plan Landuse

I categorize the map based on the Land Usage , initially i wanted to group the attributes with common words , but i feel that those attributes may meant different operations to the planner
e.g. Buisness 1 , Buisness 1 - White, Business 2
Part 2: Choropleth Mapping
- Aged population (+65) in 2010 and 2018.


- Proportional of aged population in 2010 and 2018.


- Percentage change of aged population between 2010 and 2018.
