Difference between revisions of "SMT201 AY2019-20T1 EX1 Lee Jung Jae"
Jump to navigation
Jump to search
Reasoning
| Line 24: | Line 24: | ||
== Part two == | == Part two == | ||
| + | |||
| + | === Reasoning <br> === | ||
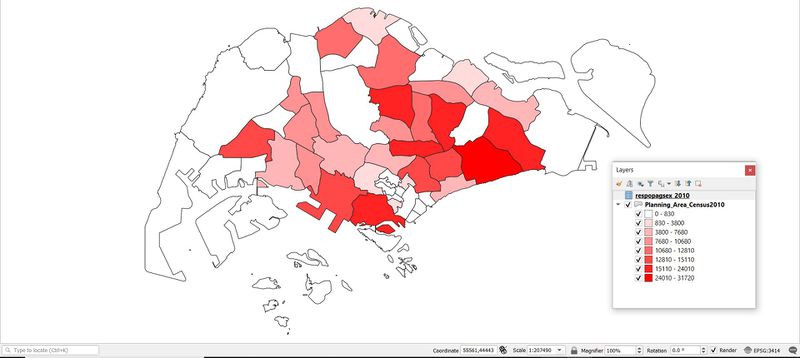
| + | The population csv file that I derived from singstat.gov.sg website was arranged in a very complex manner (divided into regions, genders, age). Thus I manually simplified the csv files into three separate files (Aged population 65+ in 2010, Aged population 65+ in 2018, and the last one showing the population percentage difference between 2010 and 2018 for aged 65+). | ||
=== 2-1 Aged population (+65) in 2010 === | === 2-1 Aged population (+65) in 2010 === | ||
Revision as of 00:24, 16 September 2019
Contents
- 1 Part One
- 2 Part two
Part One
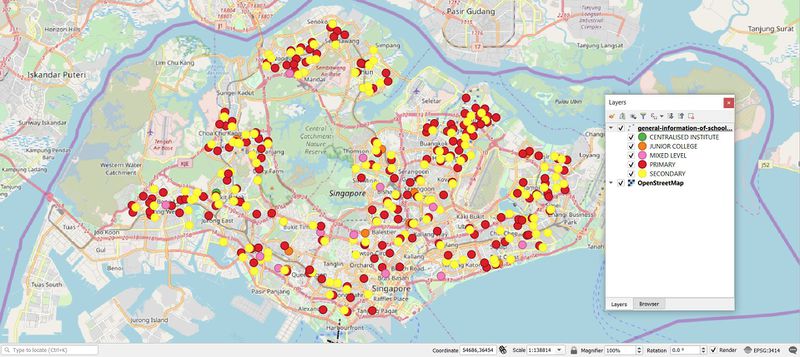
1.1 Distribution of public education institution by school types such as primary, secondary, etc.

source: data.gov.sg
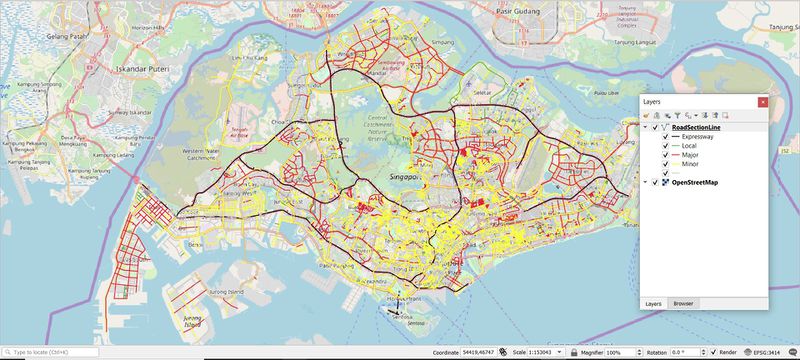
1.2 Hierarchy of road network system of Singapore such as expressway, major road, minor road, etc.

source: data.gov.sg
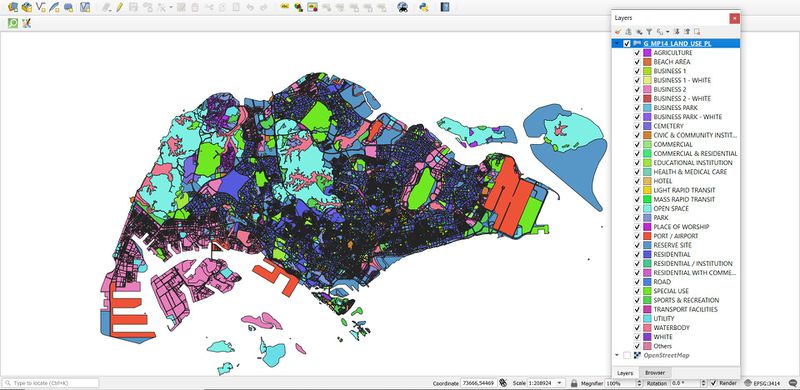
1.3 2014 Master Plan Landuse.

source: data.gov.sg
Part two
Reasoning
The population csv file that I derived from singstat.gov.sg website was arranged in a very complex manner (divided into regions, genders, age). Thus I manually simplified the csv files into three separate files (Aged population 65+ in 2010, Aged population 65+ in 2018, and the last one showing the population percentage difference between 2010 and 2018 for aged 65+).
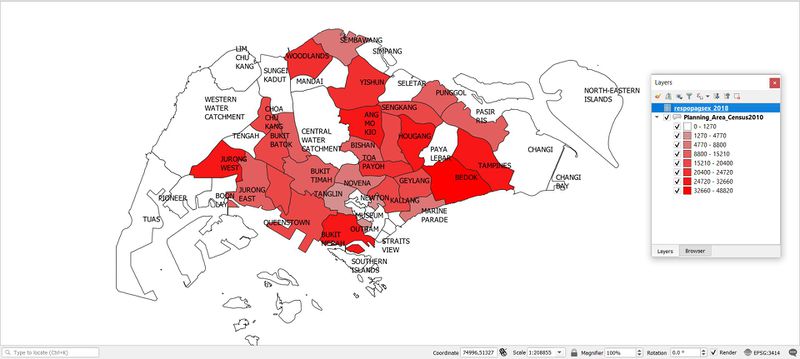
2-1 Aged population (+65) in 2010

source: data.gov.sg , singstat.gov.sg
2-1.1 Aged population (+65) in 2018

source: data.gov.sg , singstat.gov.sg
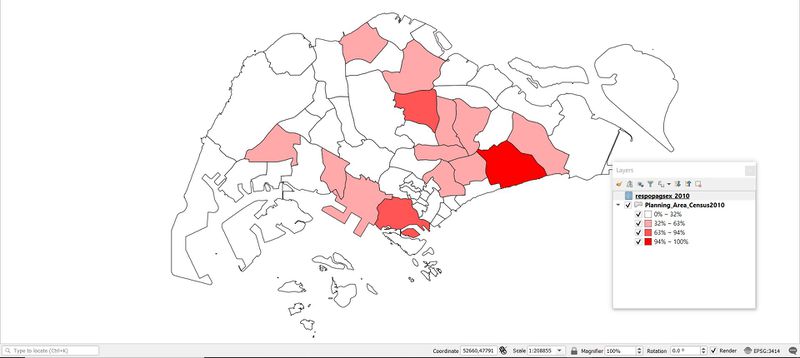
2-2 Proportional of aged population in 2010

source: data.gov.sg , singstat.gov.sg
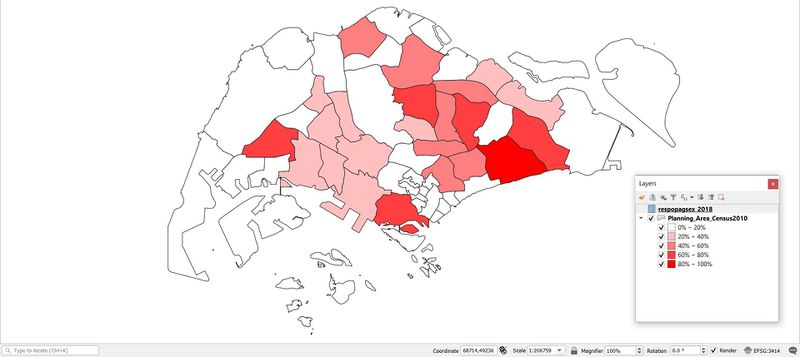
2-2 Proportional of aged population in 2018

source: data.gov.sg , singstat.gov.sg
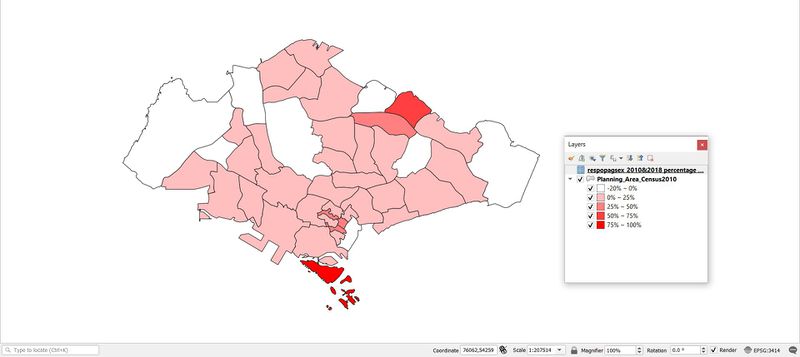
2-3 Percentage change of aged population between 2010 and 2018
