Difference between revisions of "SMT201 AY2019-20T1 EX1 Linus Cheng Xin Wei"
Jump to navigation
Jump to search
| Line 41: | Line 41: | ||
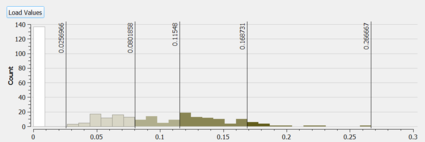
<br>[[File:Proportion distribution 2010.png|425px]]<br> | <br>[[File:Proportion distribution 2010.png|425px]]<br> | ||
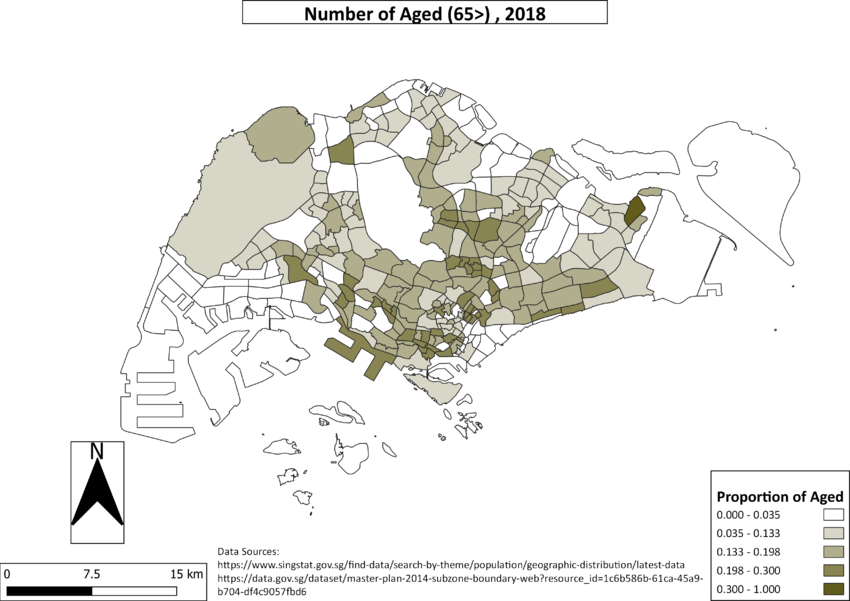
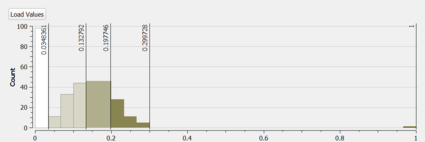
| − | === Q2b) 2018 Proportion Aged 65 | + | === Q2b) 2018 Proportion Aged 65 > === |
<br>[[File:Proportion, 2018.png|850px]]<br> | <br>[[File:Proportion, 2018.png|850px]]<br> | ||
Revision as of 20:42, 15 September 2019
Contents
- 1 Q1) Thematic Mapping
- 1.1 Q1a) Using school information from data.gov.sg, prepare a thematic map showing the distribution of public education institution by school types such as primary, secondary, etc.
- 1.2 Q1b) Using road GIS data of LTA, prepare a thematic map showing the hierarchy of road network system of Singapore such as expressway, major road, minor road, etc.
- 1.3 Q1c) Using master plan landuse GIS data from data.gov.sg, prepare a thematic map showing 2014 Master Plan Landuse.
- 2 Q2) Choropleth Mapping
Q1) Thematic Mapping
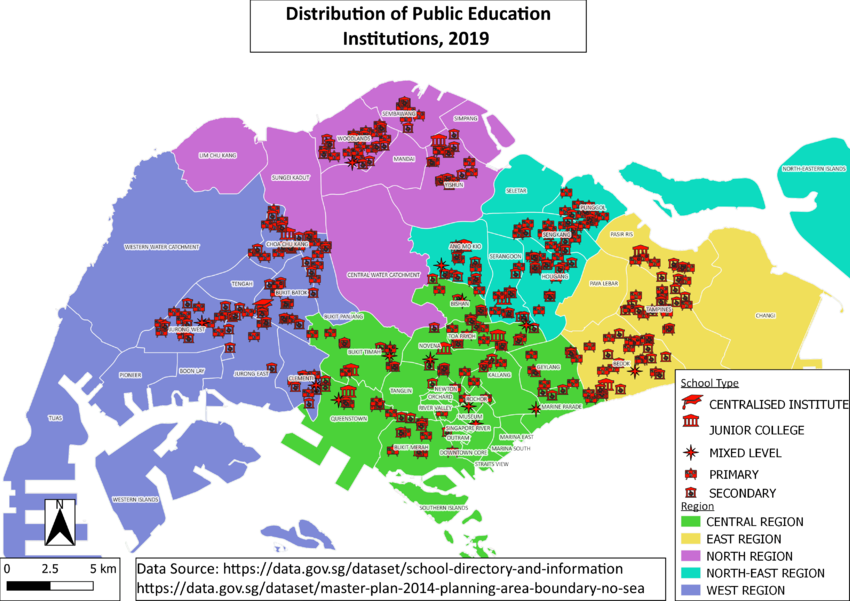
Q1a) Using school information from data.gov.sg, prepare a thematic map showing the distribution of public education institution by school types such as primary, secondary, etc.
This thematic map was built by geocoding the addresses and postal codes. I chose to give the same color to all the school types to signify equal importance between them, as someone that is searching for this information might be parents with child, who are looking for areas to start their family. To further enhance this map, I split the area by region, so viewers can easily visualize where education clusters are. I chose pastel colors to as it is light on the viewer eyes, as well as enabling the red points to stand out.
