Difference between revisions of "SMT201 AY2019-20T1 EX1 Lek Jan Yee Lois"
Jump to navigation
Jump to search


| Line 36: | Line 36: | ||
==Road System Singapore== | ==Road System Singapore== | ||
[[File:Road System Singapore.jpg|500px|frameless|left]] | [[File:Road System Singapore.jpg|500px|frameless|left]] | ||
| + | |||
| + | ==Landuse Plan 2014== | ||
| + | [[File:Landuse Plan 2014.jpg|500px|frameless|left]] | ||
| Line 87: | Line 90: | ||
==Aged Population 2018 Choropleth Map== | ==Aged Population 2018 Choropleth Map== | ||
| − | + | ||
Revision as of 20:09, 15 September 2019
Contents
- 1 Part One: Thematic Mapping
- 2 Distribution of Public Education Institutions by School Type
- 3 Road System Singapore
- 4 Landuse Plan 2014
- 5 Aged Population 2010 Choropleth Map
- 6 Aged Population 2018 Choropleth Map
- 7 Proportion of Aged Population by Subzone
- 8 Proportion of Aged Population by Subzone 2018
- 9 Percentage Change in Aged Population from 2010 to 2018
Part One: Thematic Mapping
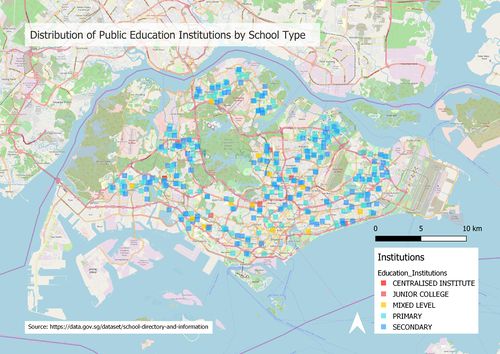
Distribution of Public Education Institutions by School Type

The data used for the Education Institutions layer is the School Directory and Information data from Data.gov. The data was geocoded using MMQGIS and categorised according to school type. The squares provide an overview of the distribution of schools. The purpose of using squares is to give a more accurate representation of the area of each school.
Road System Singapore

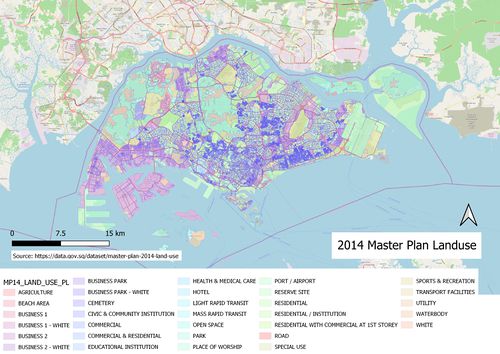
Landuse Plan 2014

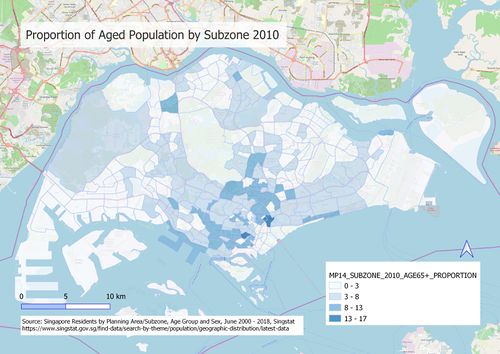
Aged Population 2010 Choropleth Map

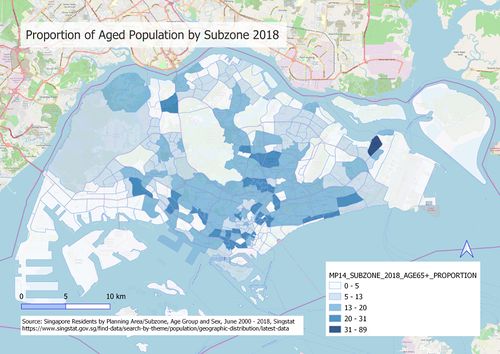
Aged Population 2018 Choropleth Map
Proportion of Aged Population by Subzone

Proportion of Aged Population by Subzone 2018

Percentage Change in Aged Population from 2010 to 2018
