Difference between revisions of "SMT201 AY2018-19T1 EX1 Tan Kin Meng"
(→=) |
|||
| Line 17: | Line 17: | ||
For the Master Plan Landuse 2014 thematic map, I used LU_DESC which is already in the dataset to classify the various landuse functions. Various hues are then used to distinguish the land use of each sub-zone within Singapore. Due to the number of types of landuse functions, I have decided that using symbols for every type of use could look disorganized. Therefore, I chose to use hues to represent each land use function. However, if the purpose is to visually identify a single landuse function such as residential land use in Singapore amongst the various landuse function, a better way may be to use symbols to distinguish them</big> | For the Master Plan Landuse 2014 thematic map, I used LU_DESC which is already in the dataset to classify the various landuse functions. Various hues are then used to distinguish the land use of each sub-zone within Singapore. Due to the number of types of landuse functions, I have decided that using symbols for every type of use could look disorganized. Therefore, I chose to use hues to represent each land use function. However, if the purpose is to visually identify a single landuse function such as residential land use in Singapore amongst the various landuse function, a better way may be to use symbols to distinguish them</big> | ||
| − | |||
| − | |||
| − | |||
| − | |||
| − | |||
| − | |||
| − | |||
| − | |||
| − | |||
| − | |||
| − | |||
| − | |||
=== | === | ||
For the Master Plan Landuse 2014 thematic map, I used LU_DESC which is already in the dataset to classify the various landuse functions. Various hues are then used to distinguish the land use of each sub-zone within Singapore. Due to the number of types of landuse functions, I have decided that using symbols for every type of use could look disorganized. Therefore, I chose to use hues to represent each land use function. However, if the purpose is to visually identify a single landuse function such as residential land use in Singapore amongst the various landuse function, a better way may be to use symbols to distinguish them. === | For the Master Plan Landuse 2014 thematic map, I used LU_DESC which is already in the dataset to classify the various landuse functions. Various hues are then used to distinguish the land use of each sub-zone within Singapore. Due to the number of types of landuse functions, I have decided that using symbols for every type of use could look disorganized. Therefore, I chose to use hues to represent each land use function. However, if the purpose is to visually identify a single landuse function such as residential land use in Singapore amongst the various landuse function, a better way may be to use symbols to distinguish them. === | ||
== PART 2 CHLOROPLETH MAP == | == PART 2 CHLOROPLETH MAP == | ||
Revision as of 19:37, 15 September 2019
PART 1 THEMATIC MAP
The map above shows the distribution of public education institutions in Singapore. For this thematic map, I used the categorize function to classify different schools with the feature "main level_". Since the data points of the school are nominal in nature I have a few options, namely, the use of shape symbols or varying hues. In this particular case, I have tried out both the options and I realized that using different hues can help the viewer distinguish the schools better than symbols. Hence, I chose hues to represent the various schools in Singapore.
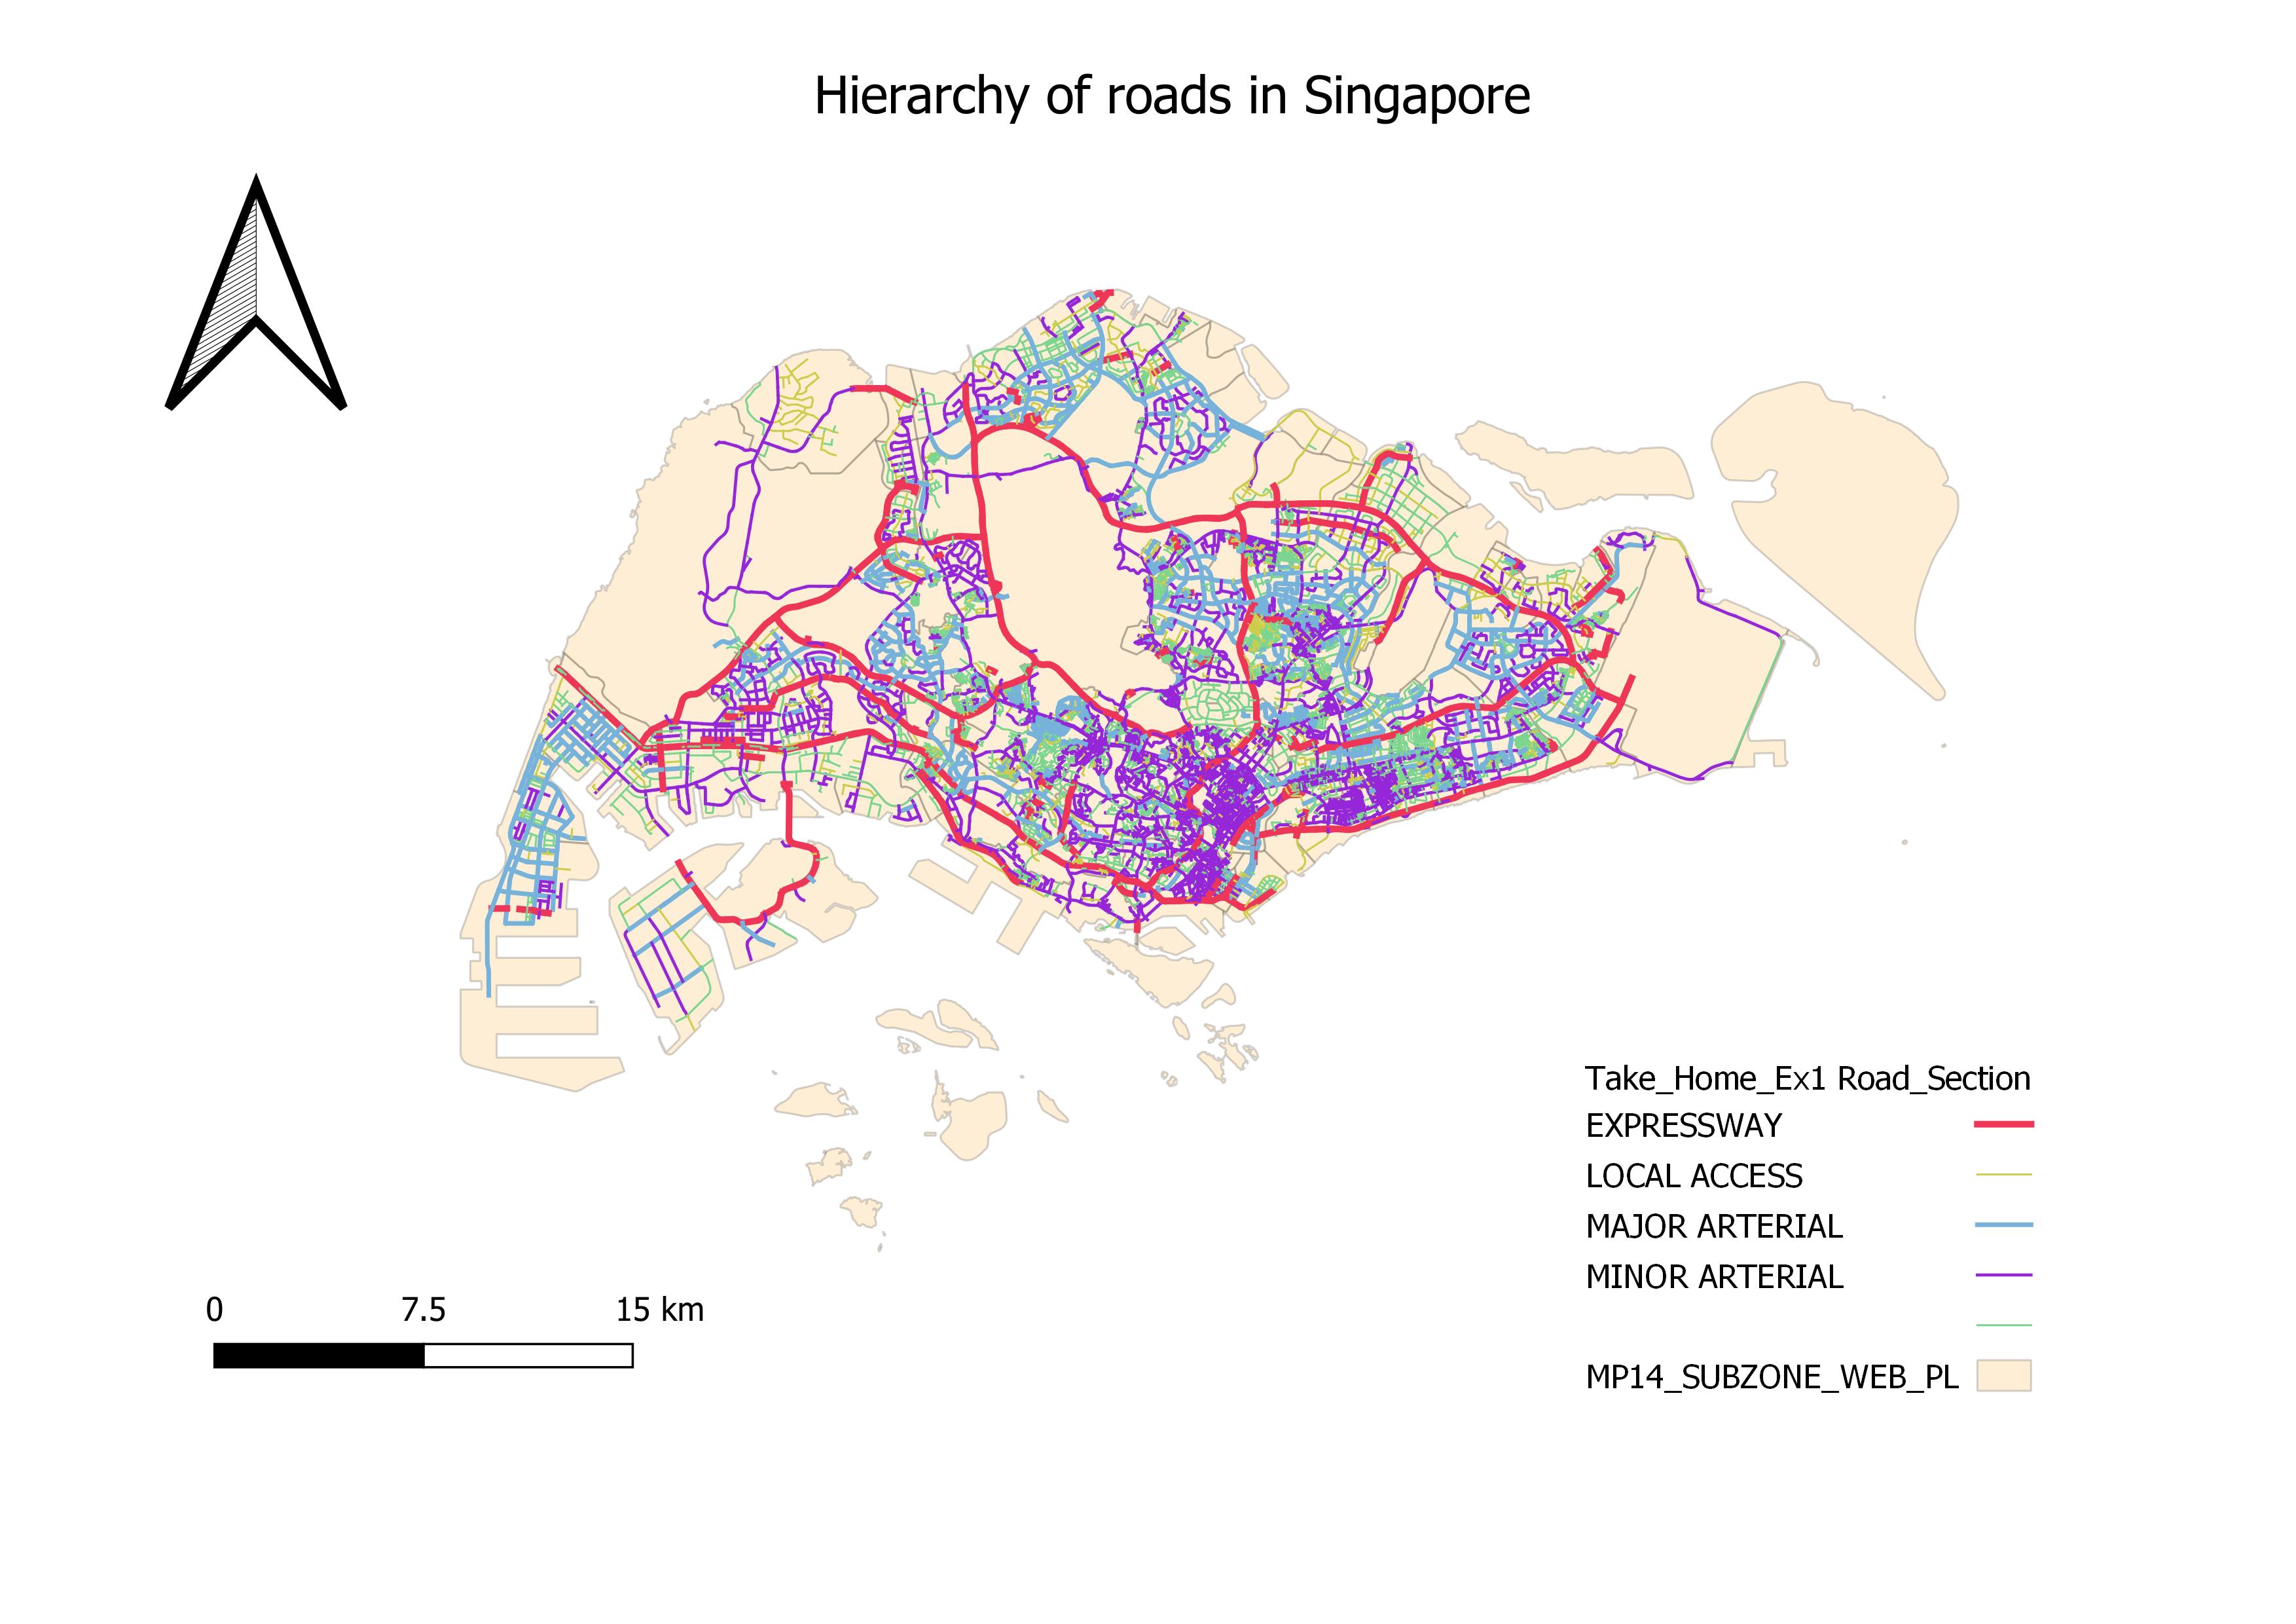
The map above shows the different hierarchies of roads in Singapore. They are namely Expressway, Major Arterial, Local Access, and Minor Arterial. I classified the hierarchy of roads based on LTA's official documentation. A new field is added and used to classify the roads based on keywords such as Expressways, Highways, Drive, Avenue etc. I then categorize them based on this new field and adjusted the width of roads as well as colors to help distinguish the hierarchy of roads.
For the Master Plan Landuse 2014 thematic map, I used LU_DESC which is already in the dataset to classify the various landuse functions. Various hues are then used to distinguish the land use of each sub-zone within Singapore. Due to the number of types of landuse functions, I have decided that using symbols for every type of use could look disorganized. Therefore, I chose to use hues to represent each land use function. However, if the purpose is to visually identify a single landuse function such as residential land use in Singapore amongst the various landuse function, a better way may be to use symbols to distinguish them
=
For the Master Plan Landuse 2014 thematic map, I used LU_DESC which is already in the dataset to classify the various landuse functions. Various hues are then used to distinguish the land use of each sub-zone within Singapore. Due to the number of types of landuse functions, I have decided that using symbols for every type of use could look disorganized. Therefore, I chose to use hues to represent each land use function. However, if the purpose is to visually identify a single landuse function such as residential land use in Singapore amongst the various landuse function, a better way may be to use symbols to distinguish them. ===

