Difference between revisions of "SMT201 AY2018-19T1 EX1 Tan Kin Meng"
| Line 3: | Line 3: | ||
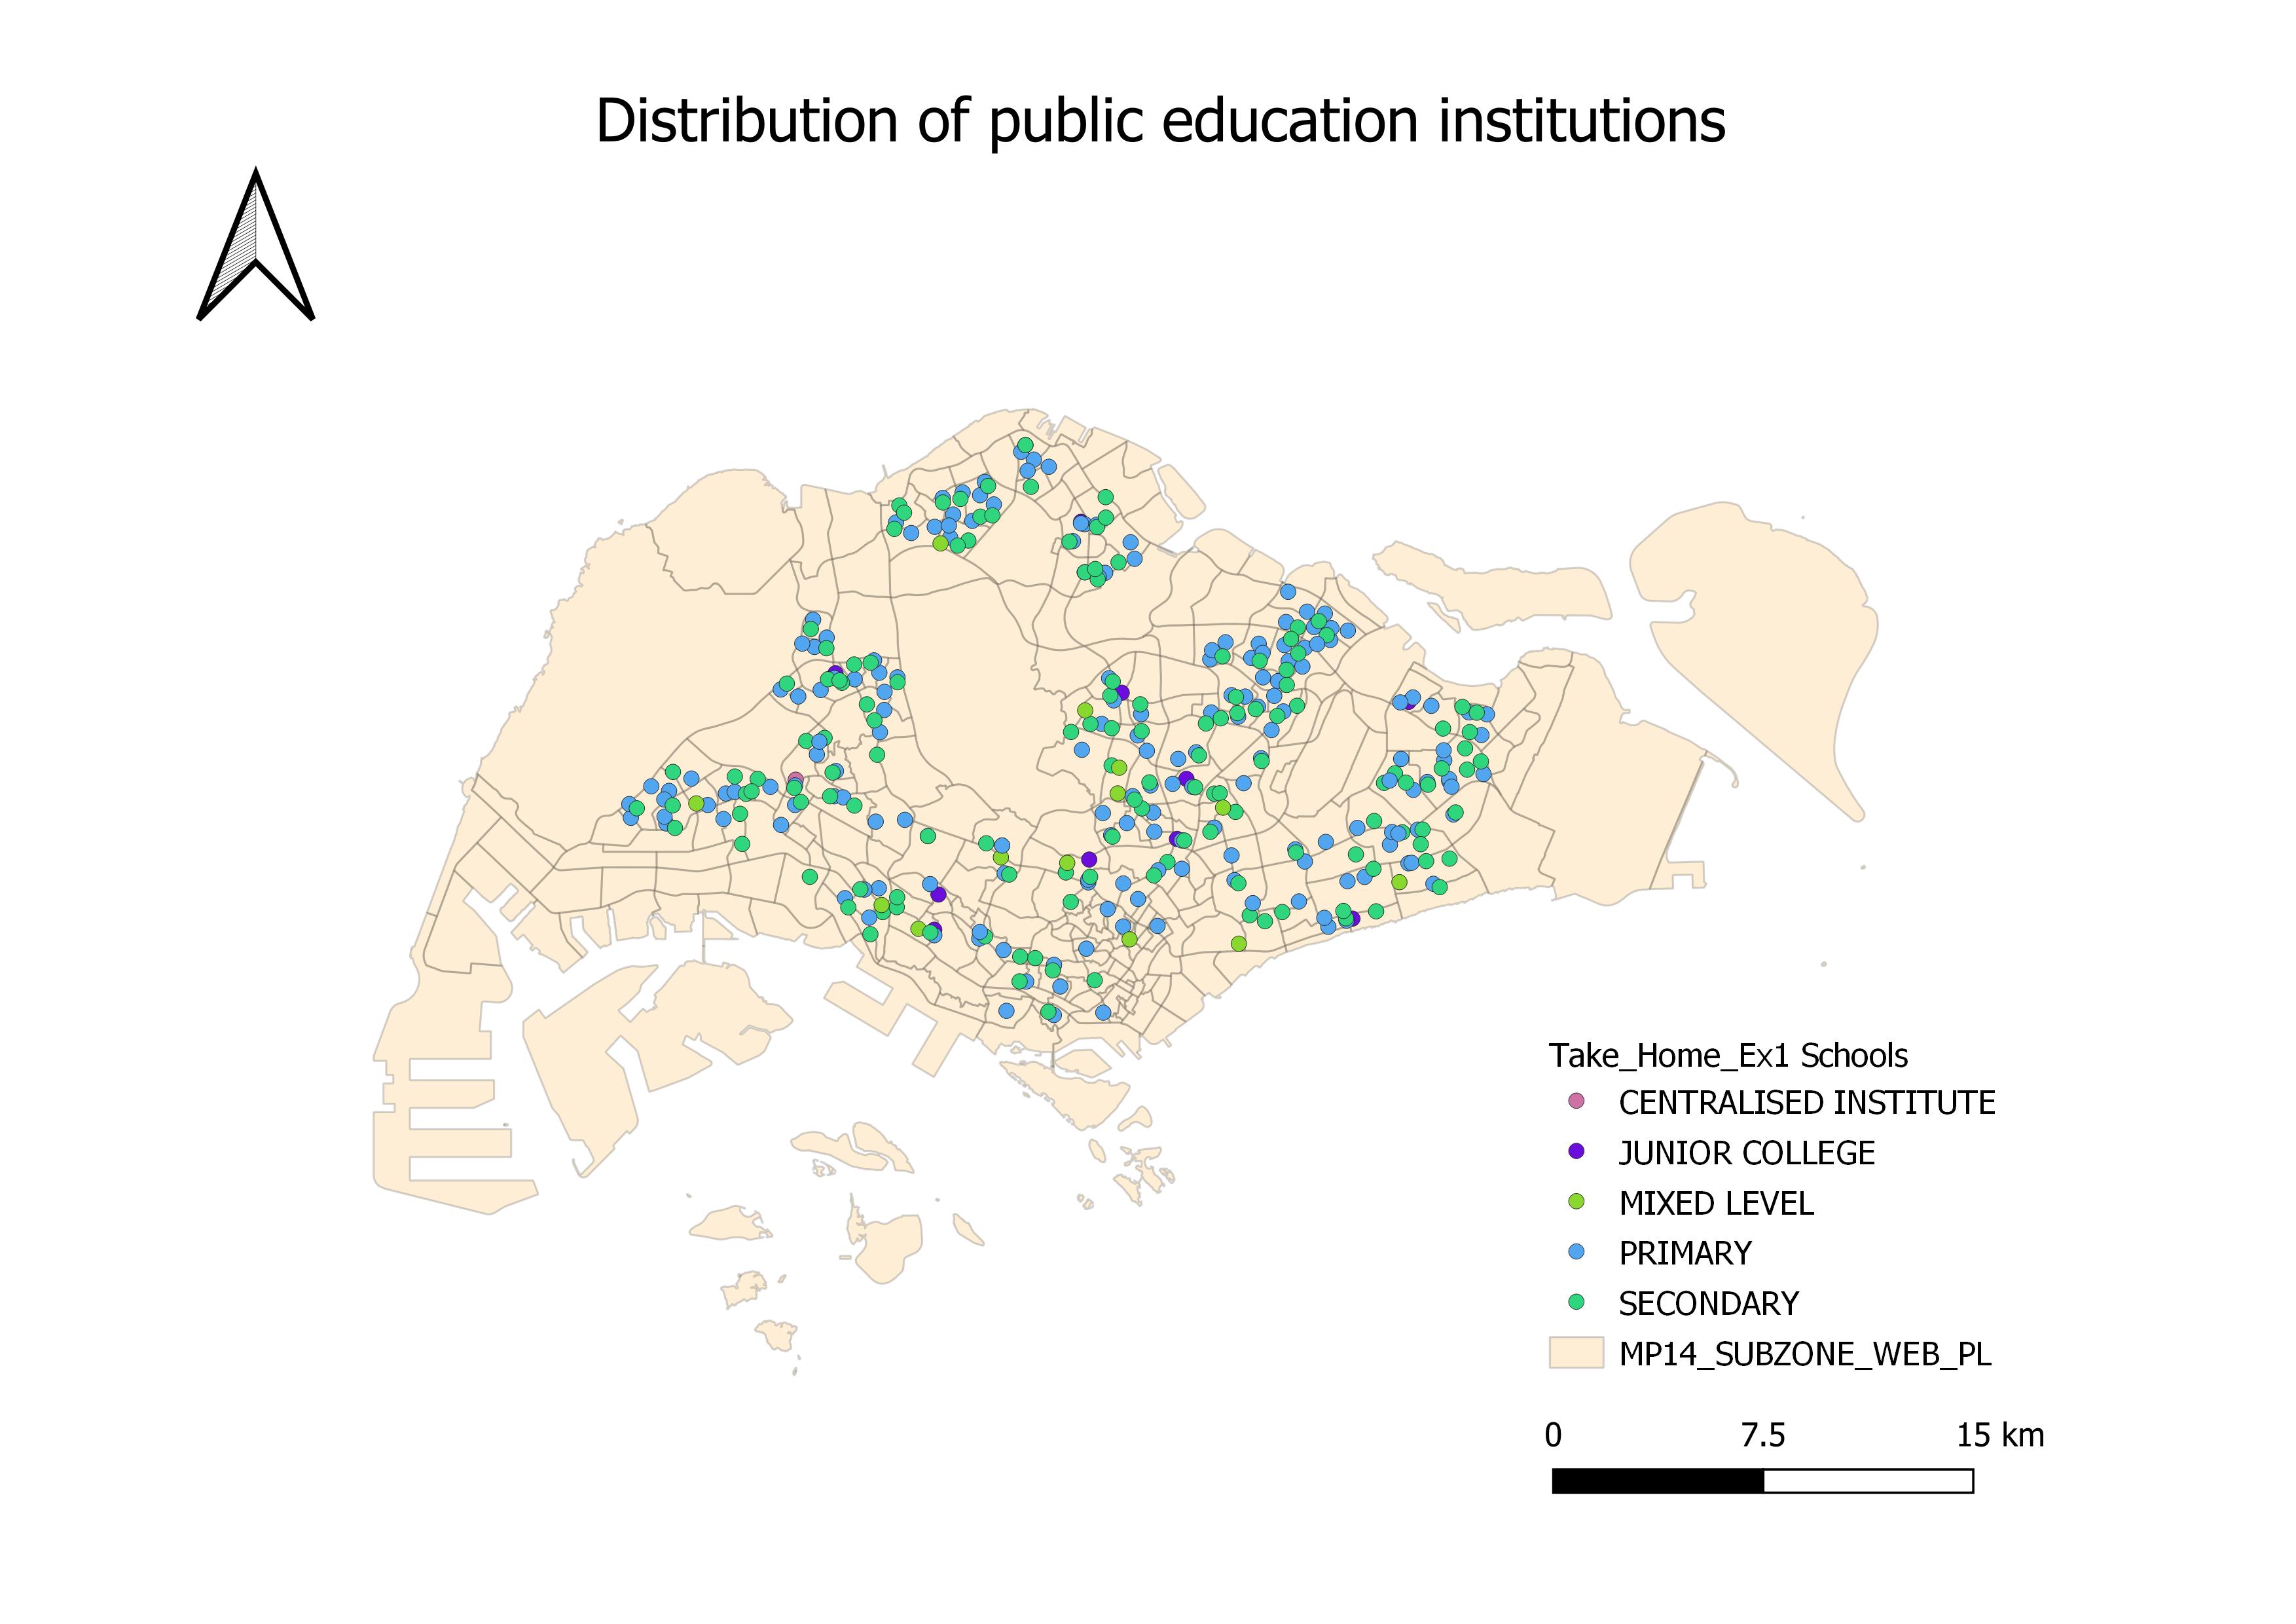
[[File:Distribution of public education institutions.jpg|center|alt text]] | [[File:Distribution of public education institutions.jpg|center|alt text]] | ||
| − | + | === | |
The map above shows the distribution of public education institutions in Singapore. For this thematic map, I used the categorize function to classify different schools with the feature "main level_". Since the data points of the school are nominal in nature I have a few options, namely, the use of shape symbols or varying hues. In this particular case, I have tried out both the options and I realized that using different hues can help the viewer distinguish the schools better than symbols. Hence, I chose hues to represent the various schools in Singapore. | The map above shows the distribution of public education institutions in Singapore. For this thematic map, I used the categorize function to classify different schools with the feature "main level_". Since the data points of the school are nominal in nature I have a few options, namely, the use of shape symbols or varying hues. In this particular case, I have tried out both the options and I realized that using different hues can help the viewer distinguish the schools better than symbols. Hence, I chose hues to represent the various schools in Singapore. | ||
| − | + | === | |
[[File:Road Network System.jpg|center|alt text]] | [[File:Road Network System.jpg|center|alt text]] | ||
| − | The map above shows the different hierarchies of roads in Singapore. They are namely Expressway, Major Arterial, Local Access, and Minor Arterial. I classified the hierarchy of roads based on LTA's official documentation. A new field is added and used | + | === The map above shows the different hierarchies of roads in Singapore. They are namely Expressway, Major Arterial, Local Access, and Minor Arterial. I classified the hierarchy of roads based on LTA's official documentation. A new field is added and used |
| − | to classify the roads based on keywords such as Expressways, Highways, Drive, Avenue etc. I then categorize them based on this new field and adjusted the width of roads as well as colors to help distinguish the hierarchy of roads. | + | to classify the roads based on keywords such as Expressways, Highways, Drive, Avenue etc. I then categorize them based on this new field and adjusted the width of roads as well as colors to help distinguish the hierarchy of roads. === |
[[File:Master Plan Landuse 2014|center|alt text]] | [[File:Master Plan Landuse 2014|center|alt text]] | ||
| − | + | === | |
| − | For the Master Plan Landuse 2014 thematic map, I used LU_DESC which is already in the dataset to classify the various landuse functions. Various hues are then used to distinguish the land use of each sub-zone within Singapore. Due to the number of types of landuse functions, I have decided that using symbols for every type of use could look disorganized. Therefore, I chose to use hues to represent each land use function. However, if the purpose is to visually identify a single landuse function such as residential land use in Singapore amongst the various landuse function, a better way may be to use symbols to distinguish them. | + | For the Master Plan Landuse 2014 thematic map, I used LU_DESC which is already in the dataset to classify the various landuse functions. Various hues are then used to distinguish the land use of each sub-zone within Singapore. Due to the number of types of landuse functions, I have decided that using symbols for every type of use could look disorganized. Therefore, I chose to use hues to represent each land use function. However, if the purpose is to visually identify a single landuse function such as residential land use in Singapore amongst the various landuse function, a better way may be to use symbols to distinguish them. === |
== PART 2 CHLOROPLETH MAP == | == PART 2 CHLOROPLETH MAP == | ||
Revision as of 19:13, 15 September 2019
PART 1 THEMATIC MAP
=
The map above shows the distribution of public education institutions in Singapore. For this thematic map, I used the categorize function to classify different schools with the feature "main level_". Since the data points of the school are nominal in nature I have a few options, namely, the use of shape symbols or varying hues. In this particular case, I have tried out both the options and I realized that using different hues can help the viewer distinguish the schools better than symbols. Hence, I chose hues to represent the various schools in Singapore.
===
=== The map above shows the different hierarchies of roads in Singapore. They are namely Expressway, Major Arterial, Local Access, and Minor Arterial. I classified the hierarchy of roads based on LTA's official documentation. A new field is added and used to classify the roads based on keywords such as Expressways, Highways, Drive, Avenue etc. I then categorize them based on this new field and adjusted the width of roads as well as colors to help distinguish the hierarchy of roads. ===
=
For the Master Plan Landuse 2014 thematic map, I used LU_DESC which is already in the dataset to classify the various landuse functions. Various hues are then used to distinguish the land use of each sub-zone within Singapore. Due to the number of types of landuse functions, I have decided that using symbols for every type of use could look disorganized. Therefore, I chose to use hues to represent each land use function. However, if the purpose is to visually identify a single landuse function such as residential land use in Singapore amongst the various landuse function, a better way may be to use symbols to distinguish them. ===

