Difference between revisions of "SMT201 AY2018-19T1 EX1 Lim Jia Khee"
| Line 3: | Line 3: | ||
=== Distribution of Public Education Institutions in Singapore === | === Distribution of Public Education Institutions in Singapore === | ||
[[File:Q1p1.jpeg|800px|center]] | [[File:Q1p1.jpeg|800px|center]] | ||
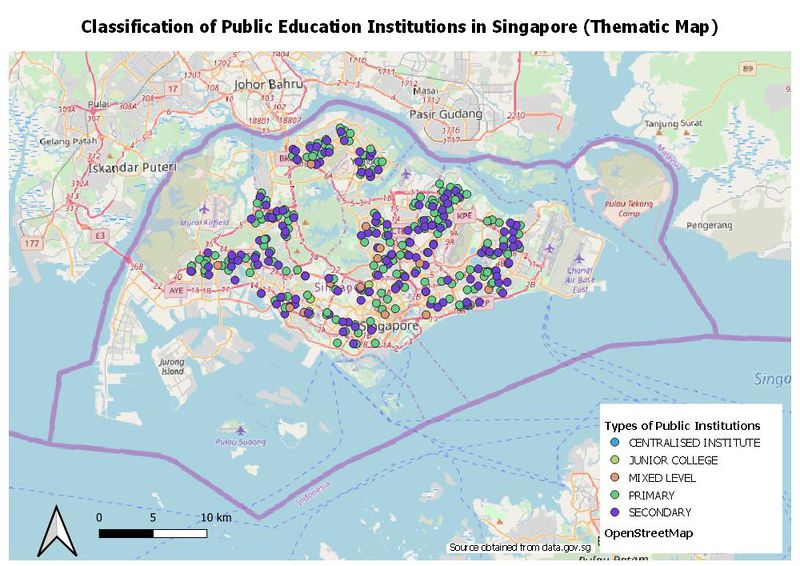
| − | + | My classification choice for this map is through the Categorized " approach, using 'mainlevel_' as the classification variable. I have chosen to differentiate the different classes through colour differentiation, with a fixed symbol size. I did not manipulate the categories within the chosen variable as the fields within the column were already well sorted out with no missing variables. I included an Open Street Map as the background for this will provide a macro understanding of the distribution of the various institution types in a quick glance. | |
| − | |||
<br><br> | <br><br> | ||
Revision as of 18:26, 15 September 2019
Contents
- 1 Part One: Thematic Mapping
- 2 Part Two: Choropleth Mapping
- 2.1 Singapore's Aged Population (65+) in 2010
- 2.2 Singapore's Aged Population (65+) in 2017
- 2.3 Proportion of Singapore's Aged Population in 2010
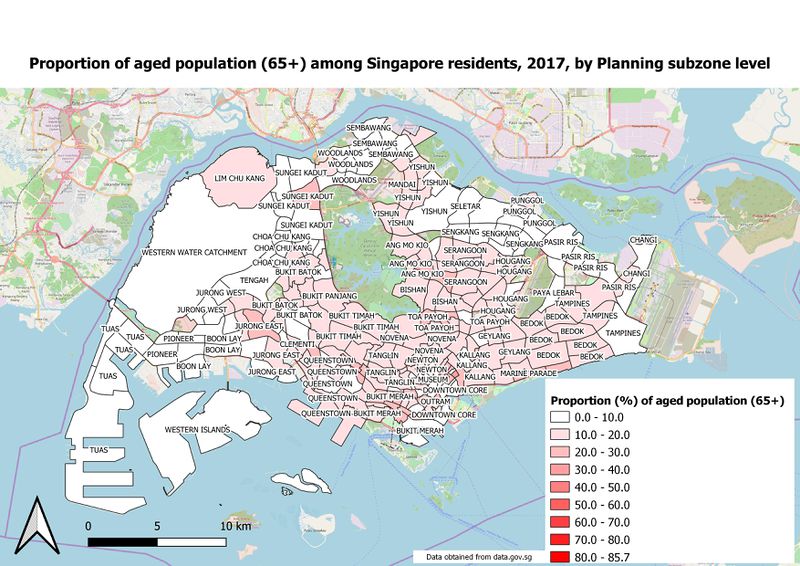
- 2.4 Proportion of Singapore's Aged Population in 2017
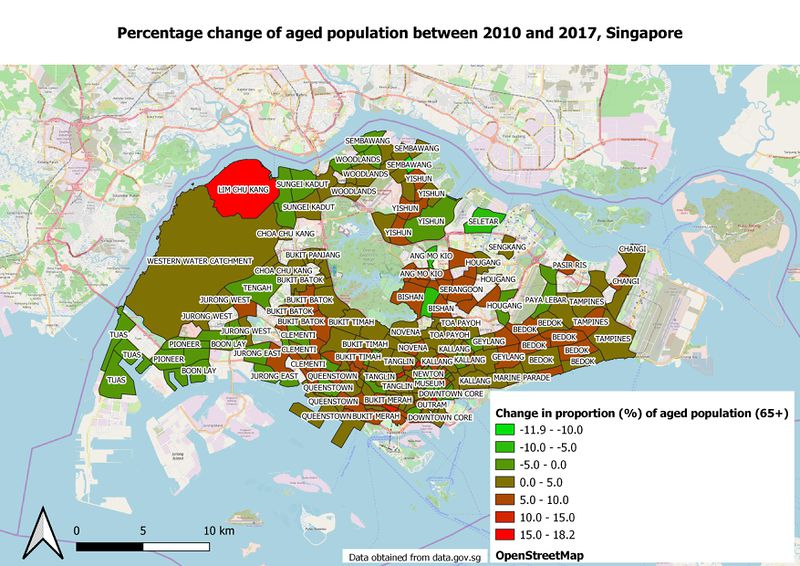
- 2.5 Percentage Change of Aged Population From 2010 to 2017
- 2.6 Reasoning behind classification choices
- 3 References and data sources
Part One: Thematic Mapping
Distribution of Public Education Institutions in Singapore
My classification choice for this map is through the Categorized " approach, using 'mainlevel_' as the classification variable. I have chosen to differentiate the different classes through colour differentiation, with a fixed symbol size. I did not manipulate the categories within the chosen variable as the fields within the column were already well sorted out with no missing variables. I included an Open Street Map as the background for this will provide a macro understanding of the distribution of the various institution types in a quick glance.
Hierarchy of Road Network System in Singapore
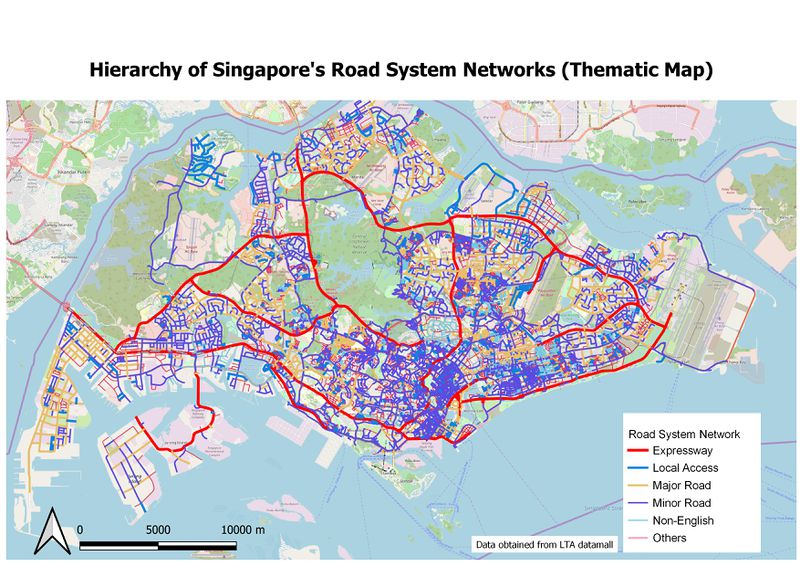
xxxx aa12321
2014 Master Plan Landuse
xxxx this xxxx
Part Two: Choropleth Mapping
Singapore's Aged Population (65+) in 2010
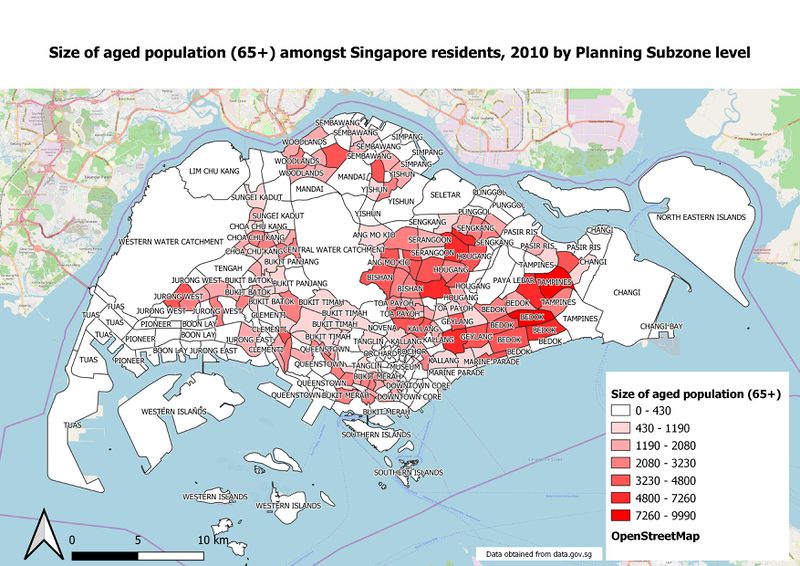
xxxxx
Singapore's Aged Population (65+) in 2017
xxx
Proportion of Singapore's Aged Population in 2010
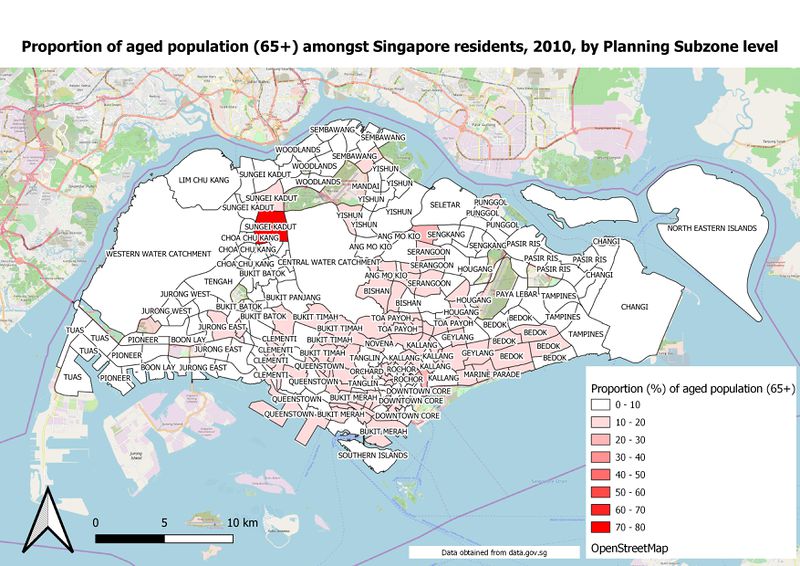
123
Proportion of Singapore's Aged Population in 2017
123213
Percentage Change of Aged Population From 2010 to 2017
123213
Reasoning behind classification choices
123321
References and data sources
1. https://www.data.gov.sg/search?q=school+information
2. https://www.data.gov.sg/dataset/master-plan-2014-land-use
3. https://www.data.gov.sg/dataset/master-plan-2014-subzone-boundary-no-sea
4. https://www.data.gov.sg/dataset/master-plan-2008-subzone-boundary-no-sea
5. https://www.remembersingapore.org/2018/08/15/singapore-street-suffixes/
6. SMT201 elearn - Week 4 Hands on Ex 4 - Coastal Outline Shapefiles from SLA
7. https://www.mytransport.sg/content/mytransport/home/dataMall/search_datasets.html?searchText=road - Road Section Line
8. https://www.data.gov.sg/dataset/singapore-residents-by-subzone-age-group-and-sex-jun-2017-gender
9. https://www.data.gov.sg/dataset/singapore-residents-by-subzone-age-group-and-sex-june-2010-gender
