Difference between revisions of "SMT201 AY2019-20G2 Ex1 Melanie Tan Ri Fang"
Jump to navigation
Jump to search
| Line 15: | Line 15: | ||
=== 2018 Population Aged 65+ === | === 2018 Population Aged 65+ === | ||
| + | |||
| + | |||
| + | === Percentage Change From 2010 and 2018 === | ||
| + | |||
| + | |||
| + | === Percentage Change From 2010 and 2018 === | ||
Revision as of 12:32, 15 September 2019
Contents
Part One: Thematic Mapping
2014 Master Plan Landuse
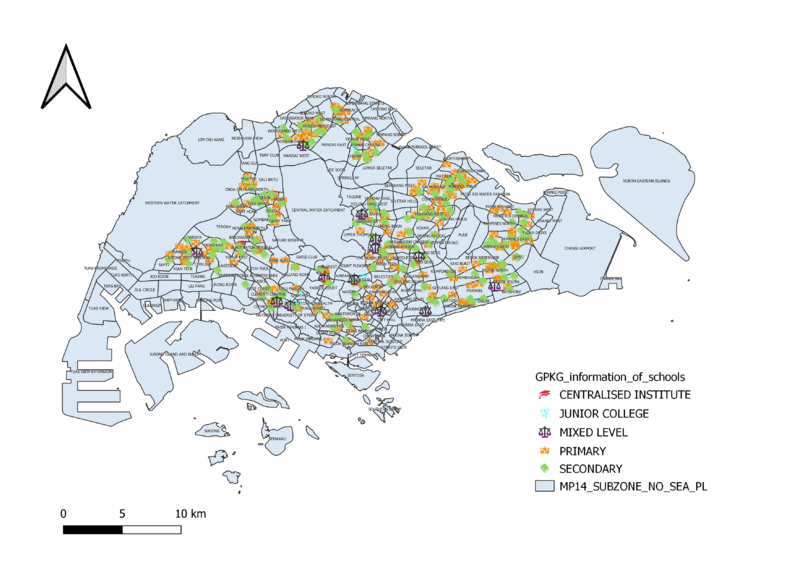
Level of Schools

From the map, primary and secondary schools are much more in numbers as compared to JC and mixed levels.I have chosen 4 different symbols to represent the different schools. It is evident that there are more primary and secondary schools thus I had to increase the size of the mixed level and JC and centralised institutions to make it more visible from the map. I also chose to use catergorised mapping which is able to show the viewers exactly which area is the schools located at.
Road Network System
[