Difference between revisions of "Criterion Score s"
Jump to navigation
Jump to search
| Line 31: | Line 31: | ||
<br> | <br> | ||
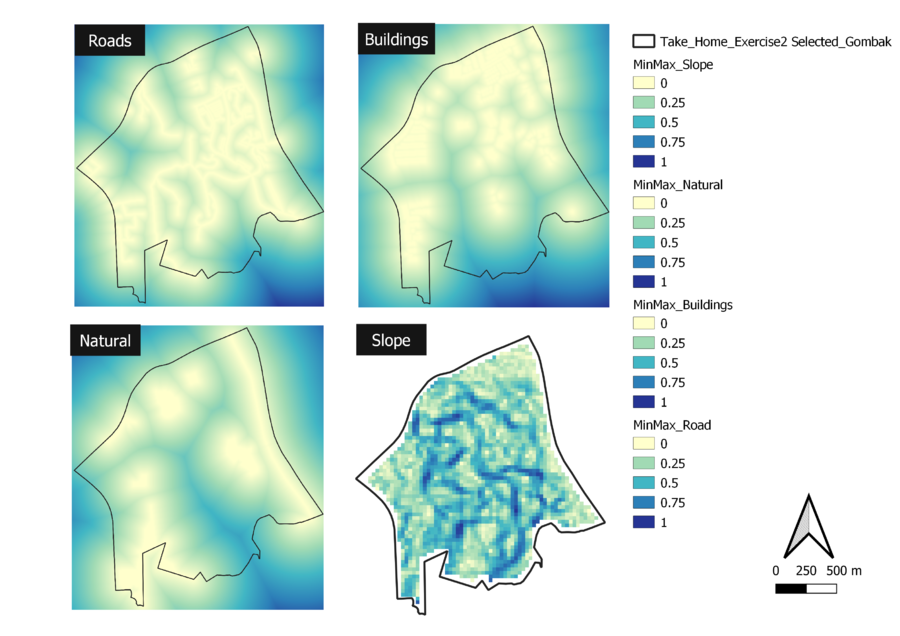
In order to ensure that the data across the four maps are standardized, the scale for the criterion score have been standardized for all. | In order to ensure that the data across the four maps are standardized, the scale for the criterion score have been standardized for all. | ||
| − | <br> | + | <br><br> |
1.The min-max formula using the raster calculator to normalize the four proximity layers. | 1.The min-max formula using the raster calculator to normalize the four proximity layers. | ||
Latest revision as of 02:57, 12 November 2019
| Overview | Proximity |
In order to ensure that the data across the four maps are standardized, the scale for the criterion score have been standardized for all.
1.The min-max formula using the raster calculator to normalize the four proximity layers.
2. Symbology
The criterion score scale of 0 (Favorable pixel value) and 1 (Unfavorable pixel value) for all four maps.
