Difference between revisions of "EX2 Lim Zhong Zhen Timothy"
| Line 87: | Line 87: | ||
<!--MAIN HEADER --> | <!--MAIN HEADER --> | ||
{|style="background-color:#32CD32;" width="100%" cellspacing="0" cellpadding="0" valign="top" border="0" | | {|style="background-color:#32CD32;" width="100%" cellspacing="0" cellpadding="0" valign="top" border="0" | | ||
| − | | style="font-family:Century Gothic; font-size:100%; solid #000000; background:#32CD32; text-align:center;" width=" | + | | style="font-family:Century Gothic; font-size:100%; solid #000000; background:#32CD32; text-align:center;" width="50%" | |
; | ; | ||
[[SMT201_AY2018-19T1_EX2_Lim_Zhong_Zhen_Timothy| <font color="#FFFFFF"> About </font>]] | [[SMT201_AY2018-19T1_EX2_Lim_Zhong_Zhen_Timothy| <font color="#FFFFFF"> About </font>]] | ||
| − | | style="font-family:Century Gothic; font-size:100%; solid #1B338F; background:#00FF00; text-align:center;" width=" | + | | style="font-family:Century Gothic; font-size:100%; solid #1B338F; background:#00FF00; text-align:center;" width="50%" | |
; | ; | ||
[[EX2_Lim_Zhong_Zhen_Timothy| <font color="#FFFFFF"> Analysis </font>]] | [[EX2_Lim_Zhong_Zhen_Timothy| <font color="#FFFFFF"> Analysis </font>]] | ||
| − | + | ||
| − | |||
|} | |} | ||
Revision as of 00:34, 11 November 2019
|
|
|
|
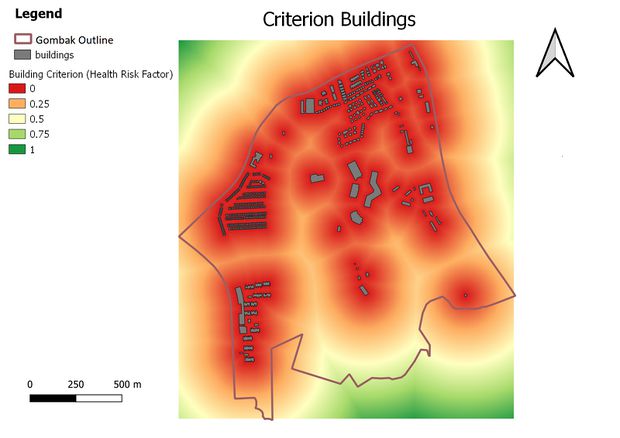
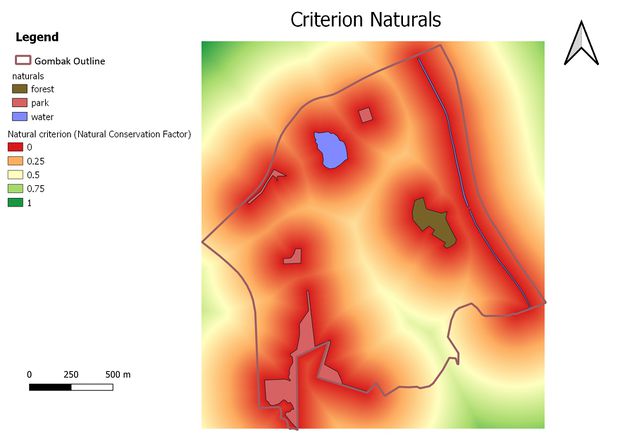
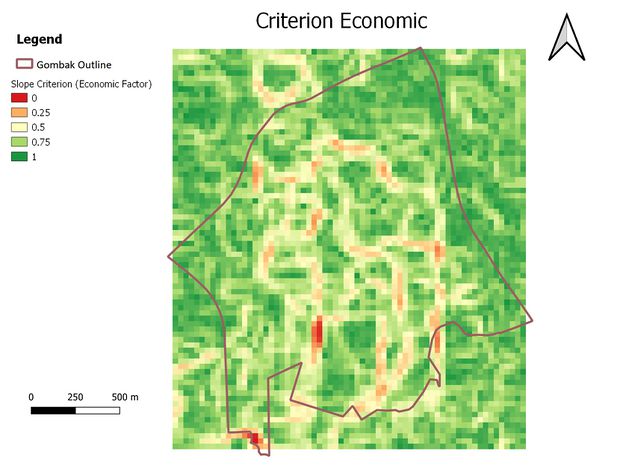
Criterion Maps
Data preparation
In order to do a ranked analysis, the layer data have to be normalised as the data now vary in scale. To that, Min-Max normalisation was used.
For example, To normalise road proximity, we take the (current_data - min_of given layer)/(max_of given layer - min_of given layer):" "Prox_road@1" - 0 / (703.28" - 0)
Another thing to note, is that the results for roads and steepness needs to be inversed. As the closer the roads or less steep the land the better!
Thus, I took (1 - normalised data) to get the correct comparison.
Next step
| Factor | Priority | Reason | AHP Scoring
|
| Health Risk | 1 | CDQC's top priority is to keep the diseased away from the general population, this is prevent the virus from spreading and causing an epidemic. Thus, this factor is highest
priority |
9 |
| Accessibility | 2 | Transportation is the key issue in swiftly getting the patient away from the masses. Thus, accessibility is also given a very high priority. | 7 |
| Natural Conservation | 3 | Although important, Parks and water beds and forests is not as populated as the buildings. | 3 |
| Economic | 4 | Singapore has limited land space, and do not have a lot of non-steep land. Thus, I believe it is worth investing on a place which poses less health risk, has good transportation and further away from natural conservation. | 1 |
Using the AHP template given by prof Kam, I performed a PairWise Comparison matrix to calculate weightage comparison of each factor.
The results show the weightage of each Factor, with 4.7% assigned to Economic, 36.6% to Accessibility, 47.9% to Health Risk and 10.9% to Natural Conservation
Suitability Map
Data prepartion
Using the data from the AHPmatrix, I created a ranked model for the suitability of the land for CDQC. To do so, I had to take the each factor multiplied by its percentage weightage.
|
|
|


