Difference between revisions of "SMT201 AY2019-20T1 EX2 Lee Jung Jae"
Jump to navigation
Jump to search
| Line 3: | Line 3: | ||
=== Roads === | === Roads === | ||
| − | + | The Roads layer shows all the roads and their types that exists within Gombak Subzone area. From the illustration, we can see that there are many sparse areas where there are no roads network at all. This could indicate that there are possibly many areas that are suitable or not suitable for building a national Communicable Disease Quarantine Centre. Further analysis is required to make a decision. | |
=== Natural Features === | === Natural Features === | ||
| − | + | The Natural features layer illustrates the different types of natural bodies that exist within Gombak Subzone area (Forest, Park, and Waterbody). As similar to the road network, there aren't much attributes within the natural features inside Gombak Subzone area. | |
=== Buildings === | === Buildings === | ||
| − | + | The Buildings layer | |
=== Elevation model === | === Elevation model === | ||
Revision as of 20:26, 10 November 2019
Contents
- 1 Part I: A map layout with four views showing Gombak (Roads, Natural Features, Buildings and Elevation)
- 2 Part II: A map layout with four views showing Proximity to Gombak Roads, Natural Features, Buildings and Slope
- 3 Part III: A map layout showing the criterion scores of each factor layers
- 4 Part IV: Analytical Hierarchical Process input matrix and result report
- 5 Part V: A map layout with the suitability land lot(s)
Part I: A map layout with four views showing Gombak (Roads, Natural Features, Buildings and Elevation)

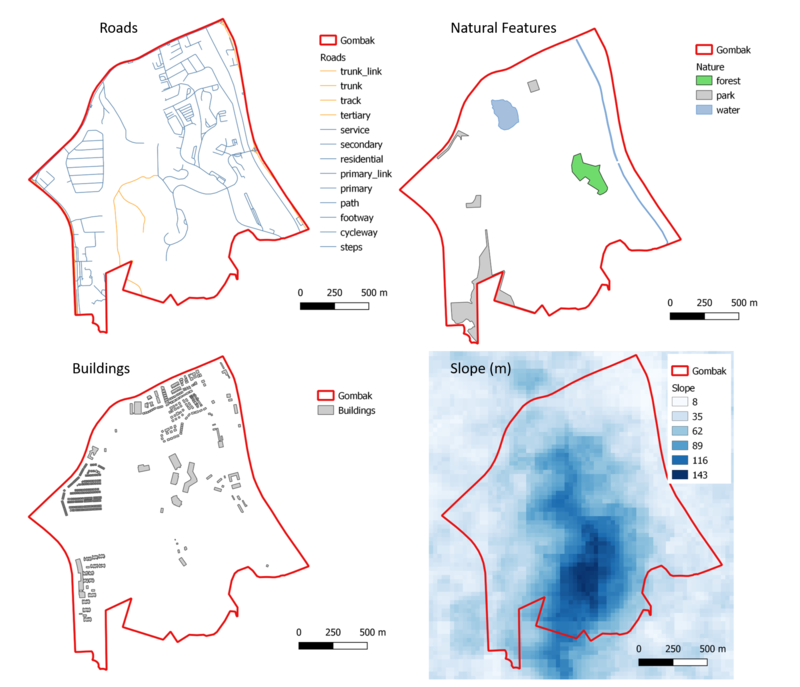
Roads
The Roads layer shows all the roads and their types that exists within Gombak Subzone area. From the illustration, we can see that there are many sparse areas where there are no roads network at all. This could indicate that there are possibly many areas that are suitable or not suitable for building a national Communicable Disease Quarantine Centre. Further analysis is required to make a decision.
Natural Features
The Natural features layer illustrates the different types of natural bodies that exist within Gombak Subzone area (Forest, Park, and Waterbody). As similar to the road network, there aren't much attributes within the natural features inside Gombak Subzone area.
Buildings
The Buildings layer
Elevation model
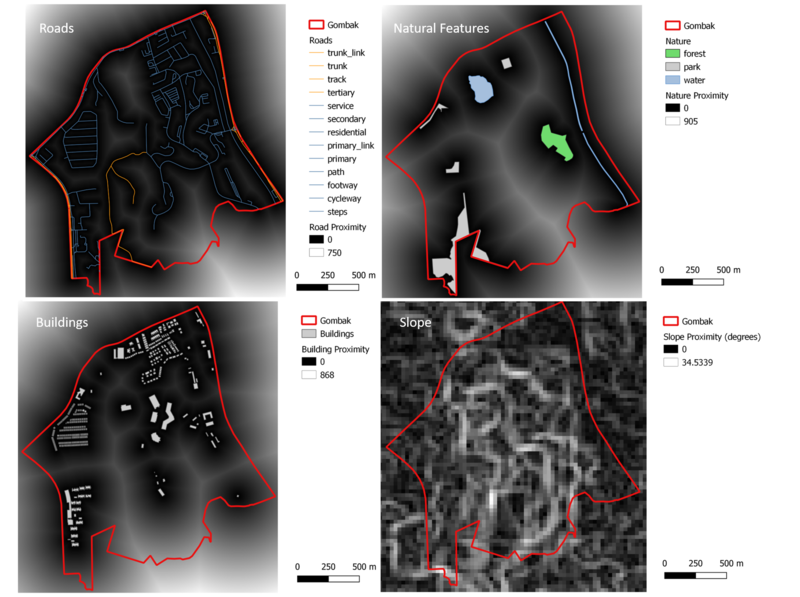
Part II: A map layout with four views showing Proximity to Gombak Roads, Natural Features, Buildings and Slope

Roads Proximity
Natural Features Proximity
Buildings Proximity
Slope Proximity
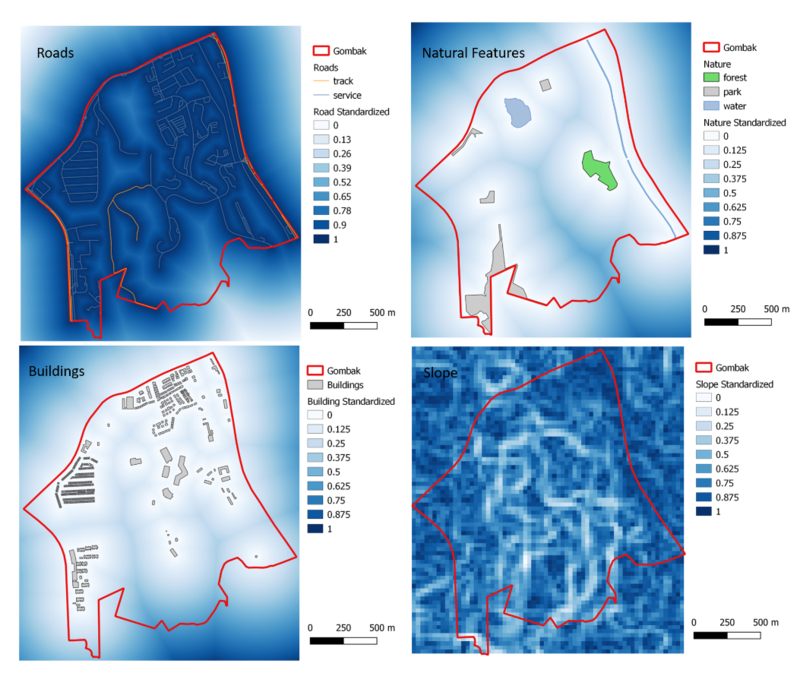
Part III: A map layout showing the criterion scores of each factor layers

Roads Criterion Scores
Natural Features Criterion Score
Buildings Criterion Score
Slope Criterion Score
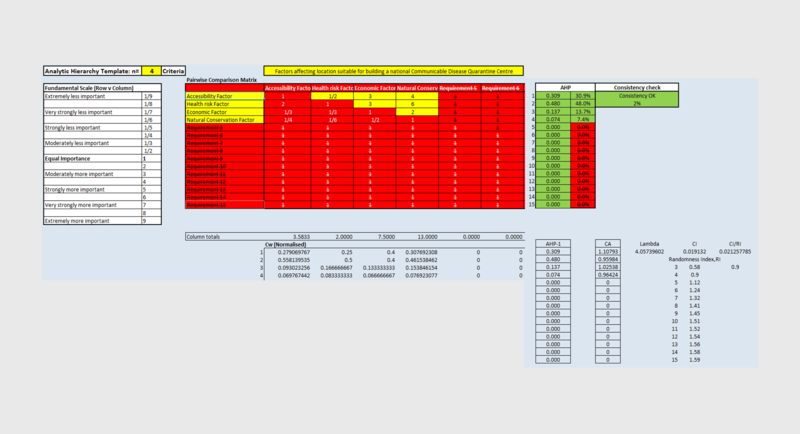
Part IV: Analytical Hierarchical Process input matrix and result report

Descriptionnnnnnnnnnnnnnnn
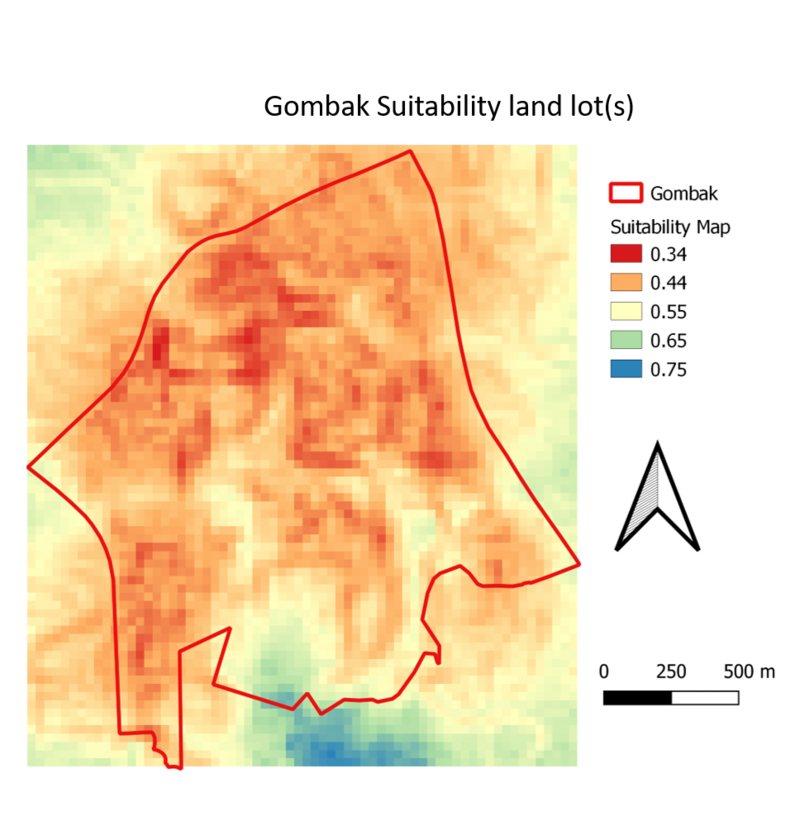
Part V: A map layout with the suitability land lot(s)
.png)