Difference between revisions of "SMT201 AY2019-20T1 EX2 Lim Jia Khee"
Jump to navigation
Jump to search


| Line 35: | Line 35: | ||
</br> | </br> | ||
| − | == Part 3: Standardisation of Proximity Analysis, Min-Max | + | == Part 3: Standardisation of Proximity Analysis, Min-Max method== |
</br> | </br> | ||
[[File:Map Layout 3.png |1000px|border|center]] | [[File:Map Layout 3.png |1000px|border|center]] | ||
| Line 41: | Line 41: | ||
{| class="wikitable" | {| class="wikitable" | ||
|- | |- | ||
| − | ! | + | ! Views (from top left to bottom left, clockwise direction) !! Description (within 100 words) |
|- | |- | ||
| − | | <center> | + | | <center>Study area and <strong>target roads</strong> layer</center> || <center>Inside Airbnb</center> |
|- | |- | ||
| − | | <center> | + | | <center>Study area and <strong>buildings</strong> layer</center> || <center>City of Seattle Open Data Portal</center> |
|- | |- | ||
| − | | <center> | + | | <center>Study area and <strong>digital elevation</strong> layer</center> || <center>Seattle.gov</center> |
|- | |- | ||
| − | | <center> | + | | <center>Study area and <strong>target natural features</strong> layer</center> || <center>Seattle GIS Open Data</center> |
|} | |} | ||
</br> | </br> | ||
Revision as of 00:40, 10 November 2019
Contents
Part 1: Data visualisation of vector layers

| Views (from top left to bottom left, clockwise direction) | Description (within 100 words) |
|---|---|
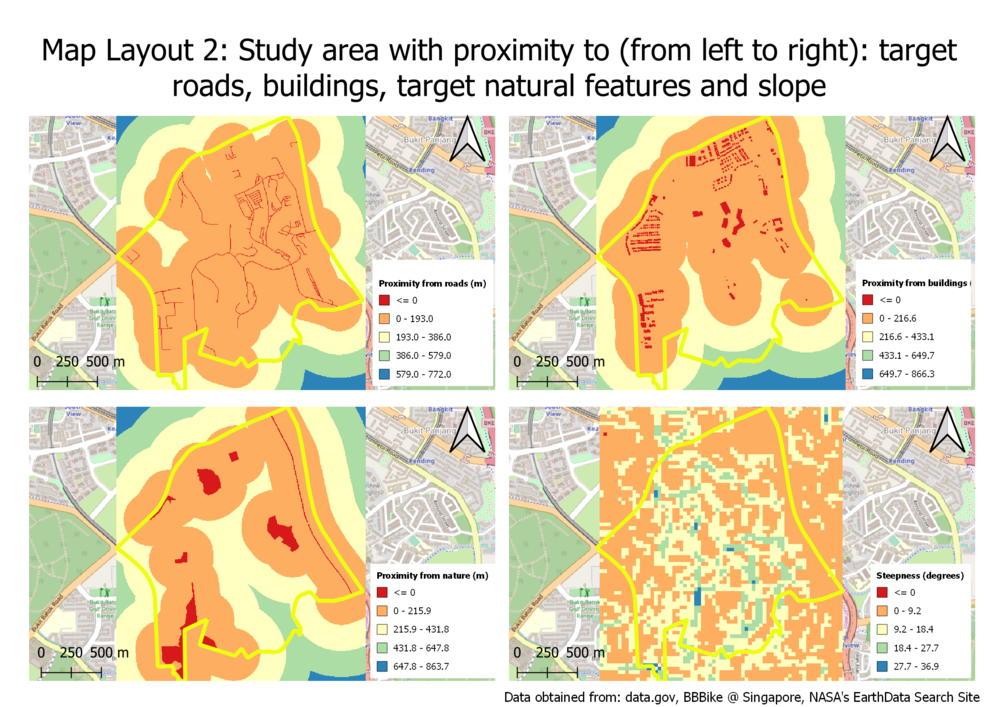
Part 2: Proximity Analysis, Raster Layers

| Views (from top left to bottom left, clockwise direction) | Description (within 100 words) |
|---|---|
Part 3: Standardisation of Proximity Analysis, Min-Max method

| Views (from top left to bottom left, clockwise direction) | Description (within 100 words) |
|---|---|
Part 4: Analytical Hierarchical Process (AHP) input matrix and result report
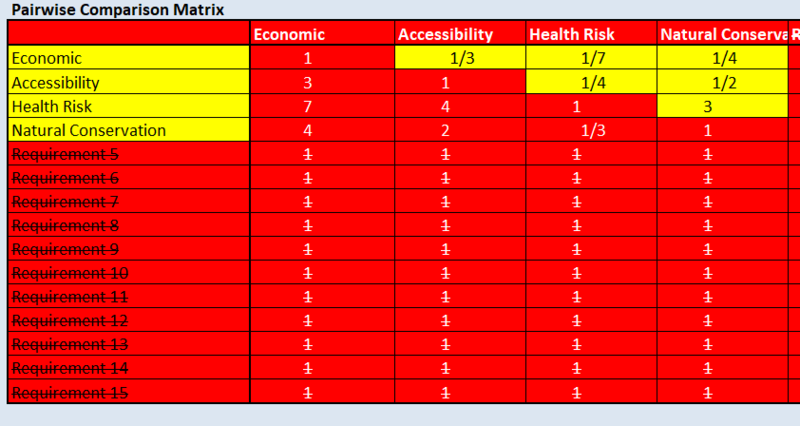 |
 |
| Data | Source | Data Description | Source URL | Data Type |
|---|---|---|---|---|
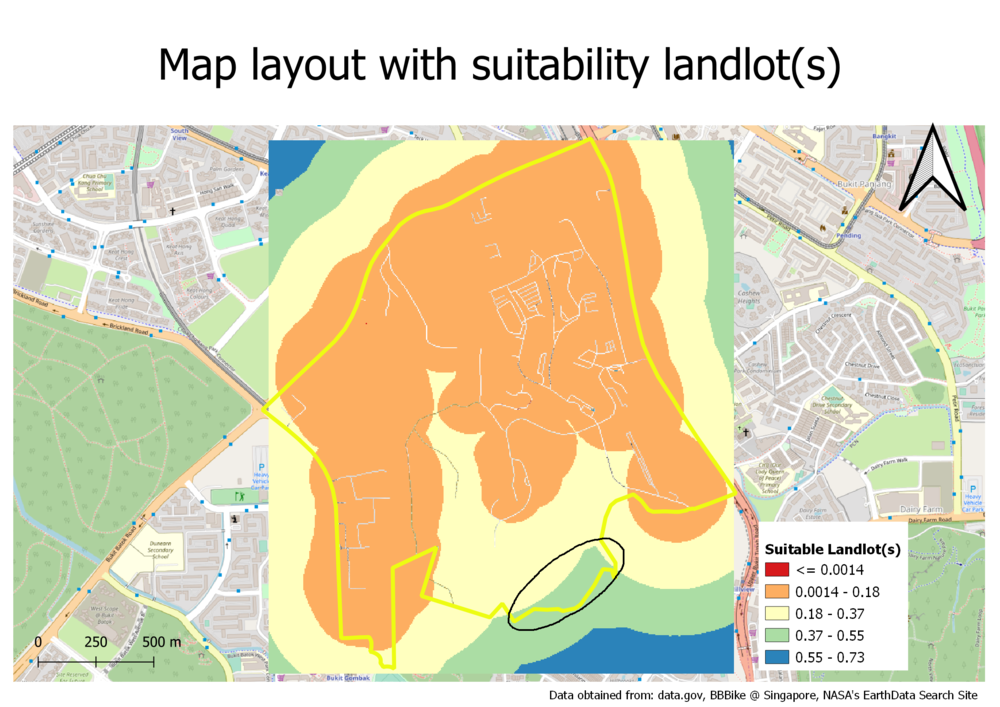
Part 5: Suitable landlot(s) identified

| Data | Source | Data Description | Source URL | Data Type |
|---|---|---|---|---|